• Streamline tuning of SQL code on major DBMSs from one interface
  • Tune SQL like a pro with automated performance optimization suggestions
  • Tackle SQL queries with visual SQL tuning diagrams
  • Pinpoint problem SQL with database profiling of wait-time analysis
  • Load test alternative SQL queries in simulated production environment
Streamline SQL Tuning Across Major DBMSs

Tune poorly performing SQL code on all major DBMSs (Oracle, SQL Server, Db2 and Sybase) from a single common interface. Reduce training requirements and streamline collaboration among teams across the organization.

Tune SQL Like a Pro!

The SQL tuning wizard automatically suggests solutions and provides essential context in tuning SQL code. Color-coded Index Analysis shows used, not used, or missing indexes and offers recommenda­tions for optimum performance. Case Generation is used to generate all possible cases and to find the best alternative to a given SQL statement by including SQL rewrites and hint injections.

Visually Tackle SQL Queries

Unique in the industry, Visual SQL Tuning (VST) diagrams turn text-based SQL code into graphical SQL diagrams. This approach helps DBAs and developers understand the impact of SQL statements on the database. The VST diagram displays indexes and constraints on tables and views with table statistics, as well as the joins used in a SQL statement such as Cartesian joins, implied Cartesian joins and many-to-many relationships.

Identify Performance Bottlenecks Immediately

Database profiling provides a graphical visualization of wait-time anal­ysis, making the SQL that is causing poor database performance easy to pinpoint. Continuous profiling monitors an entire data source within a configurable span of time. Also, explain plans are provided for a better understanding of how SQL will be executed and the performance costs. Utilize reporting to allow sharing of information captured during the profiling process.

Simulate Production Environments

Load testing verifies performance of existing and alternative SQL queries against the database. Configure queries to run multiple times in parallel and see how they respond to your simulated production environment without the risk of actually testing in production.

SQL Tuning

Multi-Platform Tuning Interface

Automate SQL tuning across all major DBMSs (Oracle, SQL Server, Db2 and Sybase) from a single common interface, and use the tool on all supported platforms from a single license. Streamline and automate common and repetitive tasks with an easy-to use GUI and powerful wizards.

SQL Rewrites & Case Generation

SQL rewrites are suggested as part of the case generation in the SQL tuner as well as when you type in the SQL IDE. SQL rewrites and hint injection are used to generate cases and find the best alternative to a given SQL statement.

Hint Injection

Customize the subset of hints to be considered for hint injection and alternative execution paths.

Explain Plan Cost

View the explain plan cost for each original statement and each generated case to give the user the expected cost given the execution path utilized by the database.

Visual SQL Tuning

The Visual SQL Tuning (VST) diagram displays indexes and constraints on tables and views as well as the joins used in a SQL statement such as Cartesian joins, implied Cartesian joins and many-to-many relationships, with table statistics.

Index Analysis

The color-coded Index Analysis feature shows indexes that are used (green), not used (blue) or missing (orange) and offers indexing recommendations for optimum performance.

Execution Statistics

Run the SQL with alternative execution paths to discover the fastest running SQL statement, and apply the change at the click of a button.

Textual Comparison of Cases

A visual difference viewer helps the user spot the textual differences between any two SQL statements.

SQL Profiling

Sampling

Identify and diagnose performance bottlenecks and problematic SQL without agents or placing a significant load on the target database.

Load Editor

SQL stress testing simulates a number of parallel users and executions over a specific period of time or execution cycle.

Continuous Profiling

Continuously profile an entire data source within a configurable span of time.

Profiling a Stored Routine

When fine tuning or testing SQL, profile the execution of a single stored routine when profiling an entire data source is not desired.

Live Data

Show data in real-time while profiling is in progress.

Sharing Profile Sessions

All data and metadata pertaining to a profile session can be saved as a single entity into an archive file. Profiles can be shared across multiple workspaces and machines for collaboration purposes.

Visual Diagnostics

Profile Chart

View the CPU, I/O, and other wait activity over the course of the session. Zoom in/out functionality available.

Execution Statistics

Detailed information on the profiled SQL and wait categories, broken down by SQL statements, events, and sessions.

Profiling Details

Drill down into the execution details for any given statement, including the SQL text, events, sessions, child cursors, blockers, procedures, and SQL details.

Predicate Analysis

SQL statements are rolled up for a true analysis of the number of executions in real-time.

Explain Plans

The Explain Plan for each SQL statement can be computed on demand via a context menu item in the Execution Statistics table. The Explain Plan appears in a separate view as a tree with columns and collapsible column groups.

Cropping

Highlights a time interval in the profile chart to instantly change the data displayed, making it easier to see the details.

Enterprise Manangement

Repository Capture

Stream profiling data into a central repository for your open session.

File Capture

Save an entire profiling session to a file for future analysis and reference or to share with other teams in the organization.

Command Line API

Launch profiling and tuning sessions remotely.

Unicode Support

Full Unicode character support throughout the application.

System Requirements

Minimum Hardware Requirements:
  • 1 GHz or faster processor
  • 3 GB of RAM
  • 1 GB of free disk space
  • 1024 x 768 display
Supported Operating Systems:
  • Windows 10, Windows 8.1, Windows 8, Windows 7 (32- and 64-bit)
  • Windows Server 2008 SP1 & 2008 R2 (32- and 64-bit)
  • Windows Server 2012 & 2012 R2
  • Windows Server 2016
Supported Database Platforms:
  • SQL Execution Tuning:
    • Microsoft SQL Server 2008, 2012, 2014, 2016, 2017
    • Microsoft SQL Server 2019 (experimental support)
    • Oracle 10g, 11g, 12c, 18c, 19c
    • Sybase ASE 15.x and 16.x
    • IBM Db2 LUW 10.x and 11.x*
    • JDBC (execution only)
  • SQL Workload Profiling:
    • Microsoft SQL Server 2008, 2012, 2014, 2016, 2017
    • Microsoft SQL Server 2019 (experimental support)
    • Oracle 10g, 11g, 12c, 18c, 19c
    • Sybase ASE 15.x and 16.x
    • IBM Db2 LUW 10.x and 11.x
Cloud
  • DB Optimizer runs on cloud virtual machines (such as Microsoft Azure VM and AWS EC2) with Microsoft Windows. It supports database instances on cloud virtual machines (such as Microsoft Azure VM and AWS EC2).
*For these databases, DB Optimizer supports a subset of this database version’s features/functions.
Note: DB Optimizer does not access the information, tables or views licensed under Oracle’s diagnostic pack.

Version History

Version 17.0.4
  • SQL Server 2019 (experimental support), Oracle 18c and 19c database support
  • Bug fixes
Version 17.0.3
  • Sybase 16.0 database support
  • Bug fixes
Version 17.0
  • SQL Server 2017 database and Windows Server 2016 OS support
  • Versionless licensing for easier upgrades
  • Bug fix for null pointer errors on shutdown
  • .msi version available for UI-free “headless” installation
Version 16.6
  • Platform support for Db2 for LUW v11 and Sybase 16.x
  • Updated installer to improve product installation experience
Version 16.5
  • DB Optimizer now has a single edition that includes all available features and has been rebranded for IDERA.
  • Now available in both 32-bit and 64-bit versions
  • Platform updates:
    • Supported Operating Systems: Windows 10, Windows Server 2012 & 2012 R2
    • Supported Database Platform: Microsoft SQL Server 2016
    • Installation Platforms: Java 8 and Eclipse 4.5.2
Version 3.8
New DBMS Version Support – This release introduces execution, tuning, and profiling support for the following DBMS versions:
  • Oracle 12c
  • Microsoft SQL Server 2012
  • Sybase ASE 15.7
Tuning Updates – Support for more hints added for the following:
  • SQL Server hints
  • Oracle 12c hints
  • Oracle 11g hints
null

DB Optimizer Datasheet

Everything you need to know, all in one downloadable PDF.
DOWNLOAD THE DATASHEET
null

The Word on the Streets

See what our customers say about DB Optimizer.
DOWNLOAD THE CASE STUDY
null

View a Democast

Let a pro show you some tips and tricks, live and free!
REGISTER FOR A DEMOCAST

Compare the top database administration tools

IDERA is focused on delivering the industry’s most complete solution for database optimization. DB Optimizer offers extensive capabilities for single- and multi-platform database performance optimization, including a unique visual tuning diagram feature.

Compare, side by side, the features and functionalities of some of the database optimization tools the market has to offer. Download a free trial of DB Optimizer today!

IDERA DB OptimizerSQL Sentry Plan ExplorerQuest SQL OptimizerSQL Server Management StudioOracle Tuning & Diagnostic Packs
Capture Workload Profile by scanning database for SQL execution activity for time periodAdd-onAdd-on
SQL Tuning Session via manual typing within SQL editor or loading a text file
SQL Tuning Session by scanning database for current SQL execution activity
Display SQL statement's database execution plan
Automatically generate SQL rewrites to potentially improve run time statistics
User can specify rules for automatic SQL rewrite allowances and exclusions
SQL rewrites can generate candidates using native database optimizer hints
SQL rewrites can generate candidates by transforming the SQL syntax itself
Recommend missing indexes which would improve execution plan
Test SQL Load Scalability by running multiple concurrent sessions for SQL statement
Visual Tuning Diagram that clarifies the data context, data relationships, data sizes and join relationships
Supports Oracle, SQL Server, Db2 and Sybase

Discover Why IDERA Has the Best SQL Server Index Defragmentation Tool

With a rich set of features, IDERA DB Optimizer enables DBAs to easily improve the performance of their SQL code and tune SQL like a pro. Try it free!

DB Optimizer Product Tour

Profile SQL execution performance: Identify and diagnose performance bottlenecks and problematic SQL without agents or placing a significant load on the target database. The profile chart shows the CPU, I/O, and other wait activity over the course of the session, in real-time while profiling is in progress. Drill down into the execution details for any given statement, including the SQL text, events, sessions, child cursors, blockers, procedures, and SQL details.

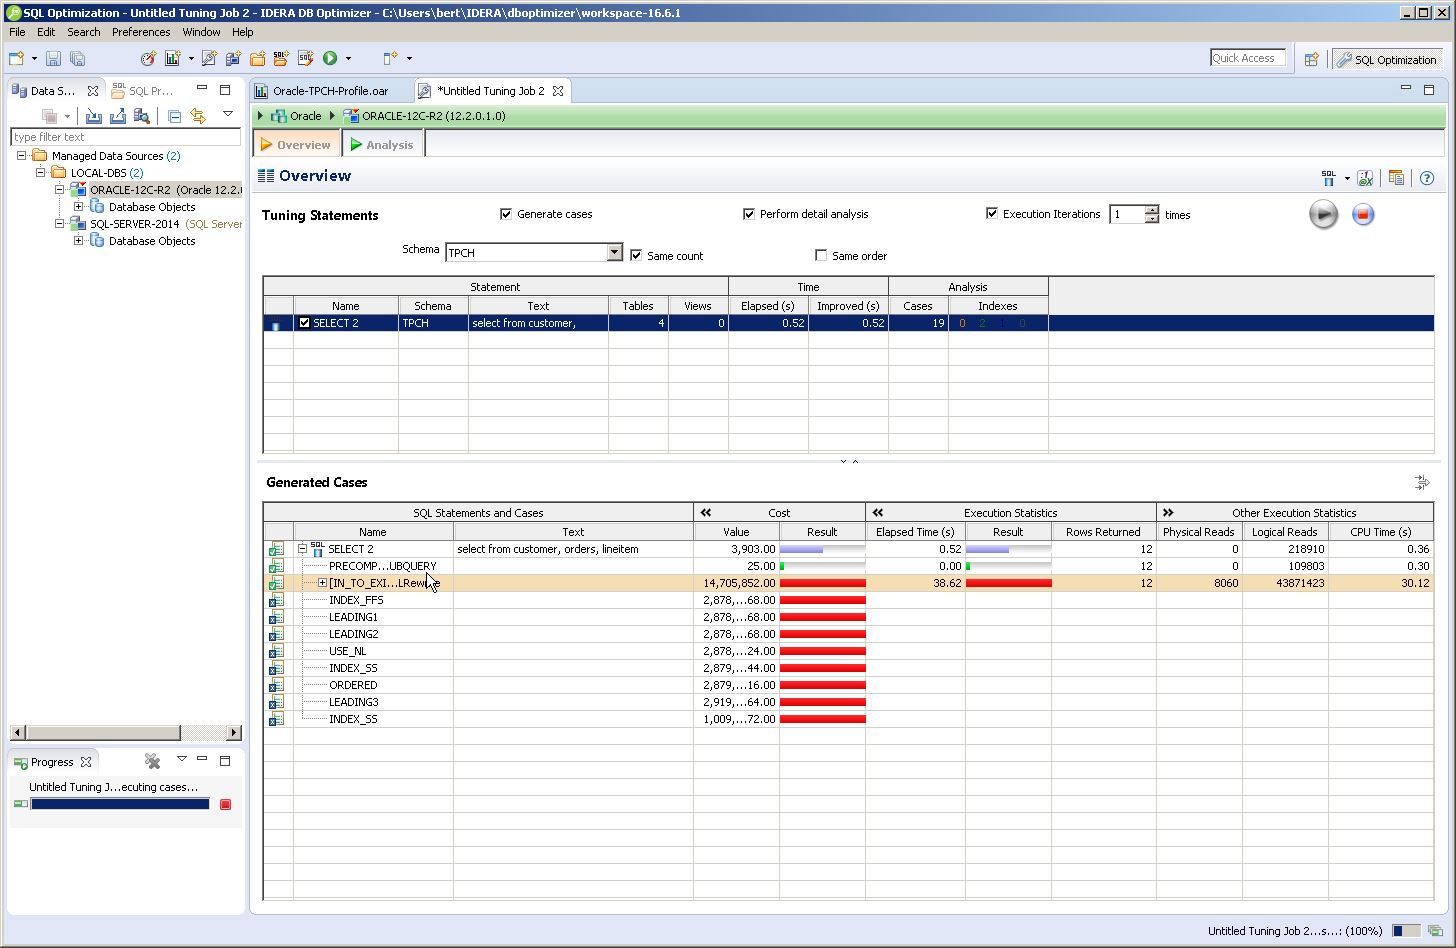
Generate SQL statements and cases: Create and run tuning jobs for a single statement or batch of statements. Tune all DML statements, stored routines and entire SQL files. View execution statistics for SQL statements and cases. SQL rewrites are suggested as part of the case generation in the SQL tuner as well as when you type in the SQL IDE.

Visually tune complex SQL queries: Unique in the industry, Visual SQL Tuning (VST) diagrams turn text-based SQL code into graphical SQL diagrams to show the impact of SQL statements on the database. The VST diagram displays indexes and constraints on tables and views with table statistics, as well as the joins used in a SQL statement.

Tune SQL like a pro: The SQL tuning wizard automatically suggests solutions for tuning SQL code. The color-coded Index Analysis shows used, not used, or missing indexes and offers recommendations for optimum performance. Find the best alternative to a given SQL statement by including SQL rewrites and hint injections.

Simulate production environments: Load testing verifies performance of existing and alternative SQL queries against the database. Configure queries to run multiple times in parallel and see how they respond to your simulated production environment without the risk of actually testing in production.
Automate SQL Tuning and Profiling

Download DB Optimizer Today!

Optimize SQL Tuning and profiling effectively.

Fully functional for 14 days. No credit card required (but all fields are).

    Overview
    • Streamline tuning of SQL code on major DBMSs from one interface
    • Tune SQL like a pro with automated performance optimization suggestions
    • Tackle SQL queries with visual SQL tuning diagrams
    • Pinpoint problem SQL with database profiling of wait-time analysis
    • Load test alternative SQL queries in simulated production environment
    Streamline SQL Tuning Across Major DBMSs

    Tune poorly performing SQL code on all major DBMSs (Oracle, SQL Server, Db2 and Sybase) from a single common interface. Reduce training requirements and streamline collaboration among teams across the organization.

    Tune SQL Like a Pro!

    The SQL tuning wizard automatically suggests solutions and provides essential context in tuning SQL code. Color-coded Index Analysis shows used, not used, or missing indexes and offers recommenda­tions for optimum performance. Case Generation is used to generate all possible cases and to find the best alternative to a given SQL statement by including SQL rewrites and hint injections.

    Visually Tackle SQL Queries

    Unique in the industry, Visual SQL Tuning (VST) diagrams turn text-based SQL code into graphical SQL diagrams. This approach helps DBAs and developers understand the impact of SQL statements on the database. The VST diagram displays indexes and constraints on tables and views with table statistics, as well as the joins used in a SQL statement such as Cartesian joins, implied Cartesian joins and many-to-many relationships.

    Identify Performance Bottlenecks Immediately

    Database profiling provides a graphical visualization of wait-time anal­ysis, making the SQL that is causing poor database performance easy to pinpoint. Continuous profiling monitors an entire data source within a configurable span of time. Also, explain plans are provided for a better understanding of how SQL will be executed and the performance costs. Utilize reporting to allow sharing of information captured during the profiling process.

    Simulate Production Environments

    Load testing verifies performance of existing and alternative SQL queries against the database. Configure queries to run multiple times in parallel and see how they respond to your simulated production environment without the risk of actually testing in production.

    Details

    SQL Tuning

    Multi-Platform Tuning Interface

    Automate SQL tuning across all major DBMSs (Oracle, SQL Server, Db2 and Sybase) from a single common interface, and use the tool on all supported platforms from a single license. Streamline and automate common and repetitive tasks with an easy-to use GUI and powerful wizards.

    SQL Rewrites & Case Generation

    SQL rewrites are suggested as part of the case generation in the SQL tuner as well as when you type in the SQL IDE. SQL rewrites and hint injection are used to generate cases and find the best alternative to a given SQL statement.

    Hint Injection

    Customize the subset of hints to be considered for hint injection and alternative execution paths.

    Explain Plan Cost

    View the explain plan cost for each original statement and each generated case to give the user the expected cost given the execution path utilized by the database.

    Visual SQL Tuning

    The Visual SQL Tuning (VST) diagram displays indexes and constraints on tables and views as well as the joins used in a SQL statement such as Cartesian joins, implied Cartesian joins and many-to-many relationships, with table statistics.

    Index Analysis

    The color-coded Index Analysis feature shows indexes that are used (green), not used (blue) or missing (orange) and offers indexing recommendations for optimum performance.

    Execution Statistics

    Run the SQL with alternative execution paths to discover the fastest running SQL statement, and apply the change at the click of a button.

    Textual Comparison of Cases

    A visual difference viewer helps the user spot the textual differences between any two SQL statements.

    SQL Profiling

    Sampling

    Identify and diagnose performance bottlenecks and problematic SQL without agents or placing a significant load on the target database.

    Load Editor

    SQL stress testing simulates a number of parallel users and executions over a specific period of time or execution cycle.

    Continuous Profiling

    Continuously profile an entire data source within a configurable span of time.

    Profiling a Stored Routine

    When fine tuning or testing SQL, profile the execution of a single stored routine when profiling an entire data source is not desired.

    Live Data

    Show data in real-time while profiling is in progress.

    Sharing Profile Sessions

    All data and metadata pertaining to a profile session can be saved as a single entity into an archive file. Profiles can be shared across multiple workspaces and machines for collaboration purposes.

    Visual Diagnostics

    Profile Chart

    View the CPU, I/O, and other wait activity over the course of the session. Zoom in/out functionality available.

    Execution Statistics

    Detailed information on the profiled SQL and wait categories, broken down by SQL statements, events, and sessions.

    Profiling Details

    Drill down into the execution details for any given statement, including the SQL text, events, sessions, child cursors, blockers, procedures, and SQL details.

    Predicate Analysis

    SQL statements are rolled up for a true analysis of the number of executions in real-time.

    Explain Plans

    The Explain Plan for each SQL statement can be computed on demand via a context menu item in the Execution Statistics table. The Explain Plan appears in a separate view as a tree with columns and collapsible column groups.

    Cropping

    Highlights a time interval in the profile chart to instantly change the data displayed, making it easier to see the details.

    Enterprise Manangement

    Repository Capture

    Stream profiling data into a central repository for your open session.

    File Capture

    Save an entire profiling session to a file for future analysis and reference or to share with other teams in the organization.

    Command Line API

    Launch profiling and tuning sessions remotely.

    Unicode Support

    Full Unicode character support throughout the application.

    Tec Specs

    System Requirements

    Minimum Hardware Requirements:
    • 1 GHz or faster processor
    • 3 GB of RAM
    • 1 GB of free disk space
    • 1024 x 768 display
    Supported Operating Systems:
    • Windows 10, Windows 8.1, Windows 8, Windows 7 (32- and 64-bit)
    • Windows Server 2008 SP1 & 2008 R2 (32- and 64-bit)
    • Windows Server 2012 & 2012 R2
    • Windows Server 2016
    Supported Database Platforms:
    • SQL Execution Tuning:
      • Microsoft SQL Server 2008, 2012, 2014, 2016, 2017
      • Microsoft SQL Server 2019 (experimental support)
      • Oracle 10g, 11g, 12c, 18c, 19c
      • Sybase ASE 15.x and 16.x
      • IBM Db2 LUW 10.x and 11.x*
      • JDBC (execution only)
    • SQL Workload Profiling:
      • Microsoft SQL Server 2008, 2012, 2014, 2016, 2017
      • Microsoft SQL Server 2019 (experimental support)
      • Oracle 10g, 11g, 12c, 18c, 19c
      • Sybase ASE 15.x and 16.x
      • IBM Db2 LUW 10.x and 11.x
    Cloud
    • DB Optimizer runs on cloud virtual machines (such as Microsoft Azure VM and AWS EC2) with Microsoft Windows. It supports database instances on cloud virtual machines (such as Microsoft Azure VM and AWS EC2).
    *For these databases, DB Optimizer supports a subset of this database version’s features/functions.
    Note: DB Optimizer does not access the information, tables or views licensed under Oracle’s diagnostic pack.

    Version History

    Version 17.0.4
    • SQL Server 2019 (experimental support), Oracle 18c and 19c database support
    • Bug fixes
    Version 17.0.3
    • Sybase 16.0 database support
    • Bug fixes
    Version 17.0
    • SQL Server 2017 database and Windows Server 2016 OS support
    • Versionless licensing for easier upgrades
    • Bug fix for null pointer errors on shutdown
    • .msi version available for UI-free “headless” installation
    Version 16.6
    • Platform support for Db2 for LUW v11 and Sybase 16.x
    • Updated installer to improve product installation experience
    Version 16.5
    • DB Optimizer now has a single edition that includes all available features and has been rebranded for IDERA.
    • Now available in both 32-bit and 64-bit versions
    • Platform updates:
      • Supported Operating Systems: Windows 10, Windows Server 2012 & 2012 R2
      • Supported Database Platform: Microsoft SQL Server 2016
      • Installation Platforms: Java 8 and Eclipse 4.5.2
    Version 3.8
    New DBMS Version Support – This release introduces execution, tuning, and profiling support for the following DBMS versions:
    • Oracle 12c
    • Microsoft SQL Server 2012
    • Sybase ASE 15.7
    Tuning Updates – Support for more hints added for the following:
    • SQL Server hints
    • Oracle 12c hints
    • Oracle 11g hints
    Resources
    null

    DB Optimizer Datasheet

    Everything you need to know, all in one downloadable PDF.
    DOWNLOAD THE DATASHEET
    null

    The Word on the Streets

    See what our customers say about DB Optimizer.
    DOWNLOAD THE CASE STUDY
    null

    View a Democast

    Let a pro show you some tips and tricks, live and free!
    REGISTER FOR A DEMOCAST
    Compare

    Compare the top database administration tools

    IDERA is focused on delivering the industry’s most complete solution for database optimization. DB Optimizer offers extensive capabilities for single- and multi-platform database performance optimization, including a unique visual tuning diagram feature.

    Compare, side by side, the features and functionalities of some of the database optimization tools the market has to offer. Download a free trial of DB Optimizer today!

    IDERA DB OptimizerSQL Sentry Plan ExplorerQuest SQL OptimizerSQL Server Management StudioOracle Tuning & Diagnostic Packs
    Capture Workload Profile by scanning database for SQL execution activity for time periodAdd-onAdd-on
    SQL Tuning Session via manual typing within SQL editor or loading a text file
    SQL Tuning Session by scanning database for current SQL execution activity
    Display SQL statement's database execution plan
    Automatically generate SQL rewrites to potentially improve run time statistics
    User can specify rules for automatic SQL rewrite allowances and exclusions
    SQL rewrites can generate candidates using native database optimizer hints
    SQL rewrites can generate candidates by transforming the SQL syntax itself
    Recommend missing indexes which would improve execution plan
    Test SQL Load Scalability by running multiple concurrent sessions for SQL statement
    Visual Tuning Diagram that clarifies the data context, data relationships, data sizes and join relationships
    Supports Oracle, SQL Server, Db2 and Sybase

    Discover Why IDERA Has the Best SQL Server Index Defragmentation Tool

    With a rich set of features, IDERA DB Optimizer enables DBAs to easily improve the performance of their SQL code and tune SQL like a pro. Try it free!

    Tour

    DB Optimizer Product Tour

    Profile SQL execution performance: Identify and diagnose performance bottlenecks and problematic SQL without agents or placing a significant load on the target database. The profile chart shows the CPU, I/O, and other wait activity over the course of the session, in real-time while profiling is in progress. Drill down into the execution details for any given statement, including the SQL text, events, sessions, child cursors, blockers, procedures, and SQL details.

    Generate SQL statements and cases: Create and run tuning jobs for a single statement or batch of statements. Tune all DML statements, stored routines and entire SQL files. View execution statistics for SQL statements and cases. SQL rewrites are suggested as part of the case generation in the SQL tuner as well as when you type in the SQL IDE.

    Visually tune complex SQL queries: Unique in the industry, Visual SQL Tuning (VST) diagrams turn text-based SQL code into graphical SQL diagrams to show the impact of SQL statements on the database. The VST diagram displays indexes and constraints on tables and views with table statistics, as well as the joins used in a SQL statement.

    Tune SQL like a pro: The SQL tuning wizard automatically suggests solutions for tuning SQL code. The color-coded Index Analysis shows used, not used, or missing indexes and offers recommendations for optimum performance. Find the best alternative to a given SQL statement by including SQL rewrites and hint injections.

    Simulate production environments: Load testing verifies performance of existing and alternative SQL queries against the database. Configure queries to run multiple times in parallel and see how they respond to your simulated production environment without the risk of actually testing in production.

    Download
    Automate SQL Tuning and Profiling

    Download DB Optimizer Today!

    Optimize SQL Tuning and profiling effectively.

    Fully functional for 14 days. No credit card required (but all fields are).

      No credit card required. Fully functional for 14 days!

      Buy Now

      Includes first year of maintenance.
      Volume discounts available

      Live Product Demo

      See DB Optimizer in action with a seasoned pro.

      No credit card required. Fully functional for 14 days!