Organizational Impact
  • Improve database end-user experience.
  • Improve database workload and database performance against organization-oriented service-level agreements.
  • Reduce lost staff productivity due to database-related performance problems.
  • Decrease database-related IT costs.
Team Impact
  • Shorten mean time to resolution of database issues.
  • Proactively resolve problems before they impact the organization.
  • Improve collaboration between database administrators and database developers.
  • Increase efficiency of database administrators and database developers.
  • Reduce finger-pointing from other IT groups and third-party vendors.
  • Maximize infrastructure investments by tuning database performance.
Benefits
  • Identify problematic SQL queries via database profiling of wait time analysis.
  • View automatically generated tuning recommendations with the SQL query tuning wizard.
  • Understand the impact of SQL statements on the database using visual SQL tuning diagrams.
  • Verify SQL queries performance with load testing in simulated production environments.
  • Reduce training requirements and streamline collaboration for tuning SQL queries with the intuitive interface.
Pinpoint Problematic SQL Queries with Wait Time Analysis

Quickly and easily identify SQL queries that cause poor database performance via database profiling that displays a graphical visualization of wait time analysis. Monitor an entire data source within a configurable span of time with continuous profiling. Gain a better understanding of how SQL Server plans to execute SQL queries and the performance costs with explain plans. Share information captured during the profiling process with reporting.

Receive Automated Tuning Suggestions

View automatically generated suggested solutions with the SQL query tuning wizard to provide an essential context for tuning SQL queries. View color-coded index analysis for used, not used, and missing indexes with recommendations for optimum performance. Generate possible cases and find the best alternative to a given SQL statement by including SQL query rewrites and hint injections.

Visually Tune Complex SQL Queries

Turn text-based SQL queries into unique visual SQL query tuning diagrams. Understand the impact of SQL statements on the database using the diagrams instead of more complicated execution plans. Display indexes and constraints on tables and views with table statistics, and the joins used in a SQL statement (such as Cartesian joins, implied Cartesian joins, and many-to-many relationships) with the diagrams.

Load Test in Simulated Production Environments

Verify the performance of existing and alternative SQL queries against the database via load testing. Configure SQL queries to run multiple times in parallel and to observe how they respond to simulated production environments without the risk of actually testing in production.

Streamline SQL Query Tuning for SQL Server

Tune poorly performing SQL queries for SQL Server from an intuitive interface. Reduce training requirements and streamline collaboration among teams across the organization.

Continuous Wait State and Transaction Monitoring

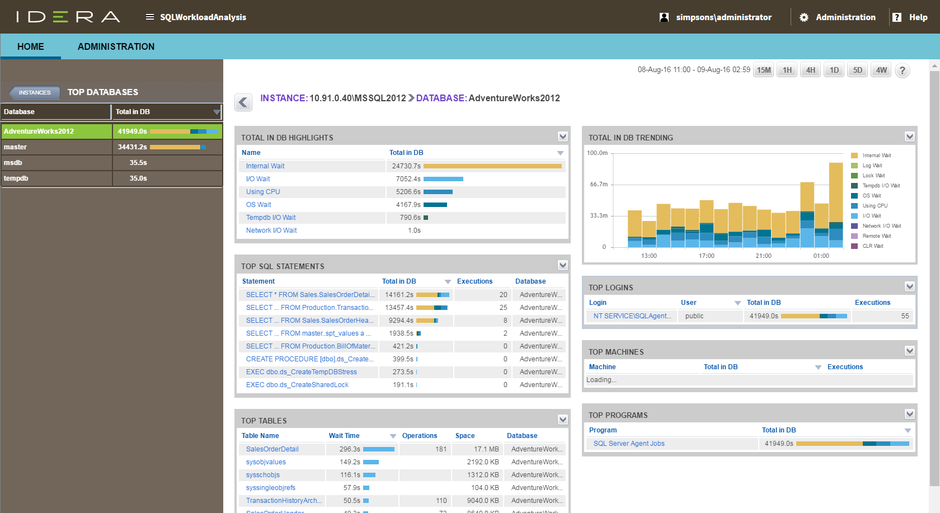
Monitor wait states and capture transactions of applications. Get a real-time view of the entire instance and database with continuous sampling and high granularity as fast as 1 second.

Quick Drill-down for Actionable Advice

Easily drill down to isolate problems quickly. View details of the captured transactions – such as top CPU activity, waits, databases, and statements versus top logins, machines, and applications – to pinpoint problems. Display and tune execution plans with actionable expert recommendations, illuminate demanding transactions, and resolve locks and latches.

Historical Query Plan Trends

SQL Workload Analysis for SQL Server delivers valuable real-time and historical data to help tune queries. Investigate historical query plan trends in SQL Server 2005 and newer systems.

Integration with SQL Diagnostic Manager for SQL Server

SQL Workload Analysis for SQL Server integrates with SQL Diagnostic Manager for SQL Server to provide wait state and transaction monitoring. From the dashboard of SQL Diagnostic Manager for SQL Server, launch SQL Workload Analysis for SQL Server in context to isolate further the transaction causes of alerts of SQL Diagnostic Manager for SQL Server for a quick resolution.

Simple Web-based Dashboard

SQL Workload Analysis for SQL Server provides a single web-based interface that is accessible via a browser from any machine that can connect to the framework machine. The customizable dashboard displays a quick and comprehensive overview of statistical analysis and activity trends of top database activity. Quickly drill down into the details of the captured transactions to isolate slow SQL statements, illuminate demanding operators, receive automatic expert recommendations to improve SQL queries, and analyze and tune execution plans.

Agentless and Low Impact

SQL Workload Analysis for SQL Server monitors SQL Server instances remotely from a dedicated framework machine. SQL Workload Analysis for SQL Server is agentless and does not install additional services, databases, tables, extended stored procedures or anything else on the production systems. This simple architecture significantly reduces server footprint, simplifies the installation and upgrade process, and eliminates risk agents on the performance of the monitored SQL servers.

SQL Query Tuning

Enjoy Intuitive Tuning Interface

Automate SQL query tuning for SQL Server from the intuitive interface. Streamline and automate frequent and repetitive tasks with an easy-to-use graphical user interface and powerful wizards.

Tune in Batches

Create and run tuning jobs for a single statement or a batch of statements. Tune all data manipulation language statements, stored routines, and entire SQL files.

Rewrite SQL Queries

Generate cases in the SQL tuner or type SQL queries into the integrated development environment to view suggested SQL rewrites.

Generate Cases

Generate all possible cases and find the best alternative to a given SQL statement with SQL query rewrites and hint injection.

Manage Hint Injection

Customize the subset of hints for consideration for hint injection and alternative execution paths.

View Explain Plan Cost

Display the explain plan cost for each original statement and each generated case to examine the expected cost given the execution path utilized by SQL Server.

Visually Tune SQL Queries

Turn text-based SQL queries into graphical tuning diagrams that display the tables and views used in the queries, and the relationships defined in those queries. Display indexes and constraints on tables and views, and the joins used in a SQL statement (such as Cartesian joins, implied Cartesian joins and many-to-many relationships) with table statistics with the visual tuning diagrams.

Analyze Indexes

View used, not used, and missing indexes and view indexing recommendations for optimum performance with the color-coded index analysis.

Examine Execution Statistics

Discover the fastest running SQL statement by running SQL queries with alternative execution paths, and apply the change with a single button click.

Compare Cases

Spot the textual differences between any two SQL statements with the visual difference viewer.

SQL Query Profiling

Use Low-impact Sampling

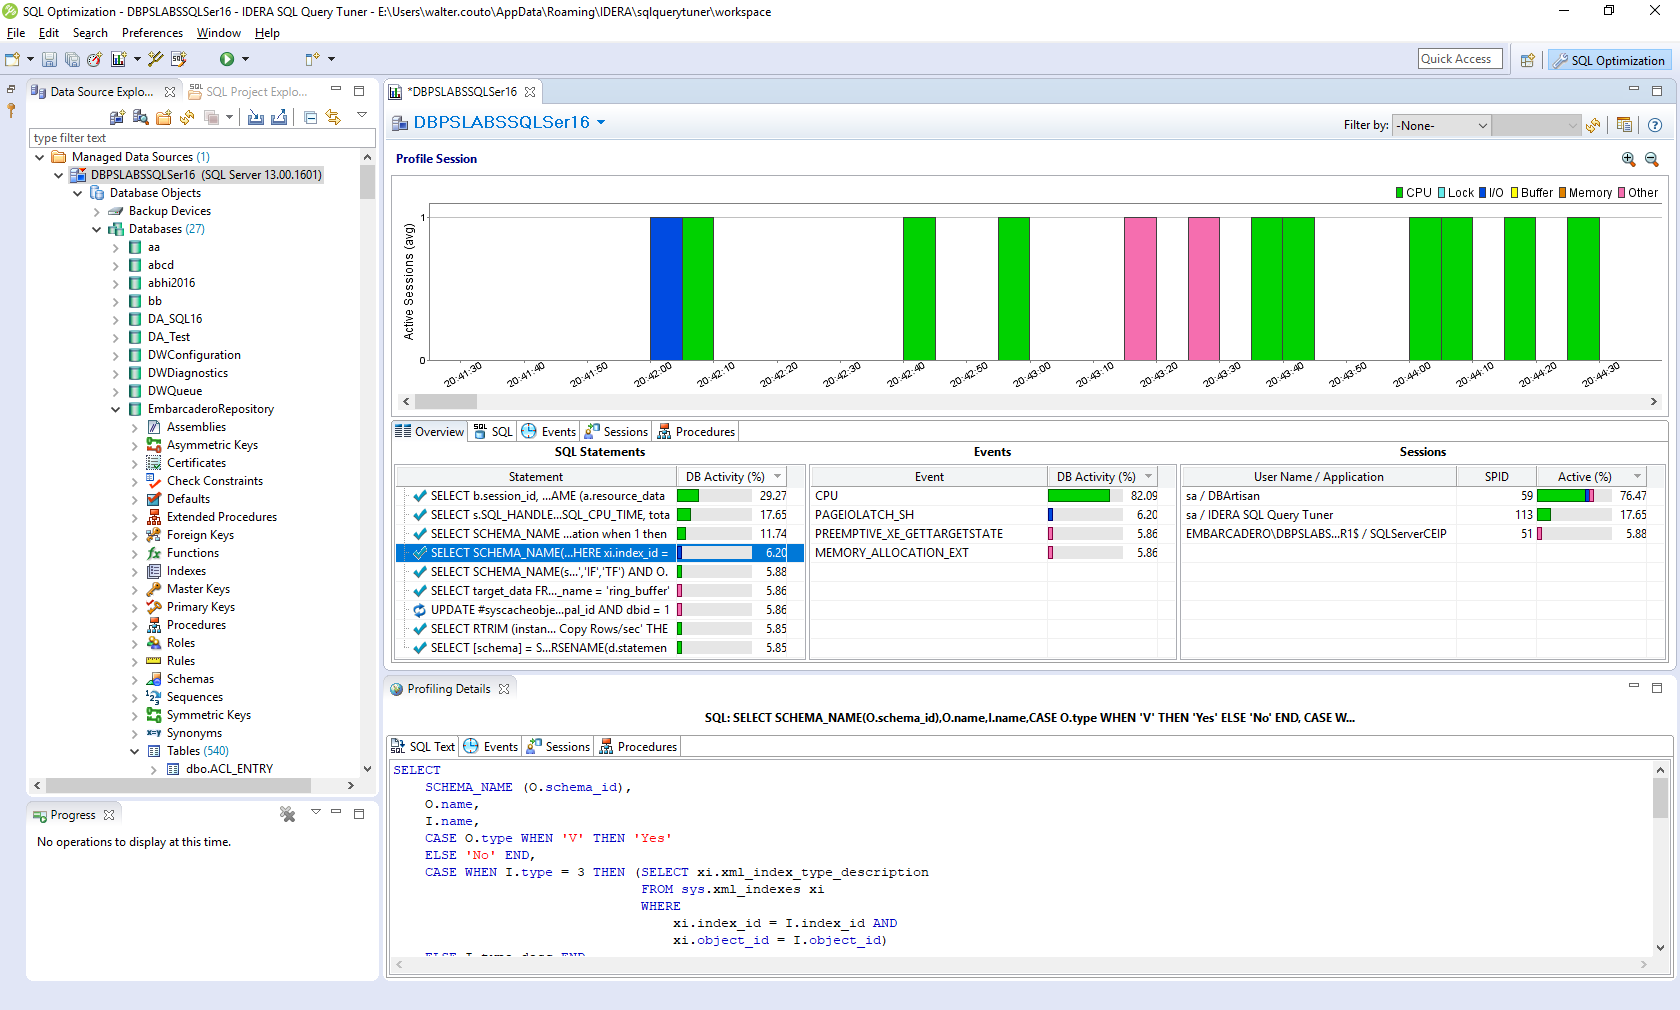
Identify and diagnose performance bottlenecks and problematic SQL queries without agents and without placing a significant load on the target database.

Test under Load

Simulate parallel users and parallel executions over a specific period or execution cycle with stress testing of SQL queries.

Profile Continuously

Continuously profile an entire data source within a configurable span of time.

Show Live Data

Show data in real-time while profiling is in progress.

Share Profile Sessions

Save all data and metadata about a profile session as a single entity into an archive file. Share profiles across multiple workspaces and machines to collaborate with others.

Visual diagnostics

View Profile Chart

Show the CPU, input and output, and other wait activity over the course of the session in the profile chart, and zoom in and out as desired.

Examine Execution Statistics

Display detailed information on the profiled SQL query and wait categories. Break down this information into SQL statements, events, and sessions.

Drill Down into Profiling Details

Drill down into the execution details for any given statement which includes the SQL query text, events, sessions, child cursors, blockers, procedures, and SQL query details.

Summarize Execution Analysis

Roll up SQL statements for an accurate analysis of the number of executions in real-time.

Generate Explain Plans

Compute the explain plan for each SQL statement on demand via a context menu item in the execution statistics table. Display the explain plan in a separate view as a tree with columns and collapsible column groups.

Crop Time Displays

Highlight a time interval in the profile chart to instantly change the data displayed to make it easier to see the details.

Enterprise Manangement

Store Profiling Data

Stream profiling data into a central repository for the open session.

Save Profiling Session

Save an entire profiling session to file for future analysis and reference, and to share with others.

Automate and Remote-control Tuning Sessions

Automate and launch profiling and tuning sessions remotely with the intuitive command-line interface.

Use Unicode Characters

Utilize Unicode characters throughout the application.

System Requirements

Operating Systems

  • Microsoft Windows: 10, 8.1, 8, 7, Server 2008 SP1, Server 2008 R2, Server 2012, Server 2012 R2, Server 2016; 32- and 64-bit.

Database Platforms

SQL Execution Tuning

  • Microsoft SQL Server: 2008, 2012, 2014, 2016, 2017 (Windows and Linux)
  • Microsoft SQL Server 2019 (experimental support)
  • Java Database Connectivity (for execution only)

SQL Workload Profiling

  • Microsoft SQL Server: 2008, 2012, 2014, 2016, 2017
  • Microsoft SQL Server 2019 (experimental support)

Version History

Version 17.0.4

  • Support for SQL Server 2019 (Windows and Linux) (experimental support)
  • Bug fixes

Version 17.0.3

  • Support for Windows authentication on all Windows platforms including Windows Server 2016

SQL Query Tuner for SQL Server Product Video

Watch this video to learn about how SQL Query Tuner can help you to boost the performance monitoring power of SQL Diagnostic Manager with SQL query tuning for SQL Server.

null

Read the Datasheet

Everything you need you need to know, all in one downloadable PDF.
DOWNLOAD THE DATASHEET
null

View a Democast

Let a pro show you some tips and tricks, live and free!
REGISTER FOR A DEMOCAST
(SQL Query Tuner is an add-on to SQL Diagnostic Manager.)
Compare the Best SQL Server Query Tuning Tools

IDERA relentlessly delivers the industry’s most complete solution for profiling and tuning SQL queries for SQL Server and tirelessly supports the SQL Server community with 100% free tools and expert advice.

Compare, side by side, the features and functionalities of the best SQL Server query tuning tools the market has to offer. Download a free trial today.
(SQL Query Tuner is an add-on to SQL Diagnostic Manager.)

IDERA SQL Query TunerSQL Sentry® Plan ExplorerQuest® SQL OptimizerSQL® Server Management Studio
Capture Workload Profile by scanning database for SQL query execution activity for the period.Add-on
SQL Tuning Session via manual typing within SQL query editor or loading a text file.
SQL Tuning Session by scanning database for current SQL query execution activity.
Display SQL statement's database execution plan.
Automatically generate SQL query rewrites to improve runtime statistics potentially.
he user can specify rules for automatic SQL query rewrite allowances and exclusions.
SQL query rewrites can generate candidates using native database optimizer hints.
SQL query rewrites can generate candidates by transforming the SQL syntax itself.
Recommend missing indexes which would improve execution plan.
Test SQL Load Scalability by running multiple concurrent sessions for SQL statement.
Visual Tuning Diagram that clarifies the data context, data relationships, data sizes, and join relationships.

With a rich set of features, IDERA SQL Query Tuner enables DBAs and developers to quickly improve the performance of their SQL queries for SQL Server like a professional.

SQL Query Tuner for SQL Server Product Tour

SQL Query Execution Performance: Identify and diagnose performance bottlenecks and problematic SQL queries for SQL Server without agents or placing a significant load on the target database. The profile chart shows the CPU, input and output, and other wait activity over the course of the session, in real-time while profiling is in progress. Drill down into the execution details for any given statement, including the SQL query text, events, sessions, child cursors, blockers, procedures, and SQL query details.

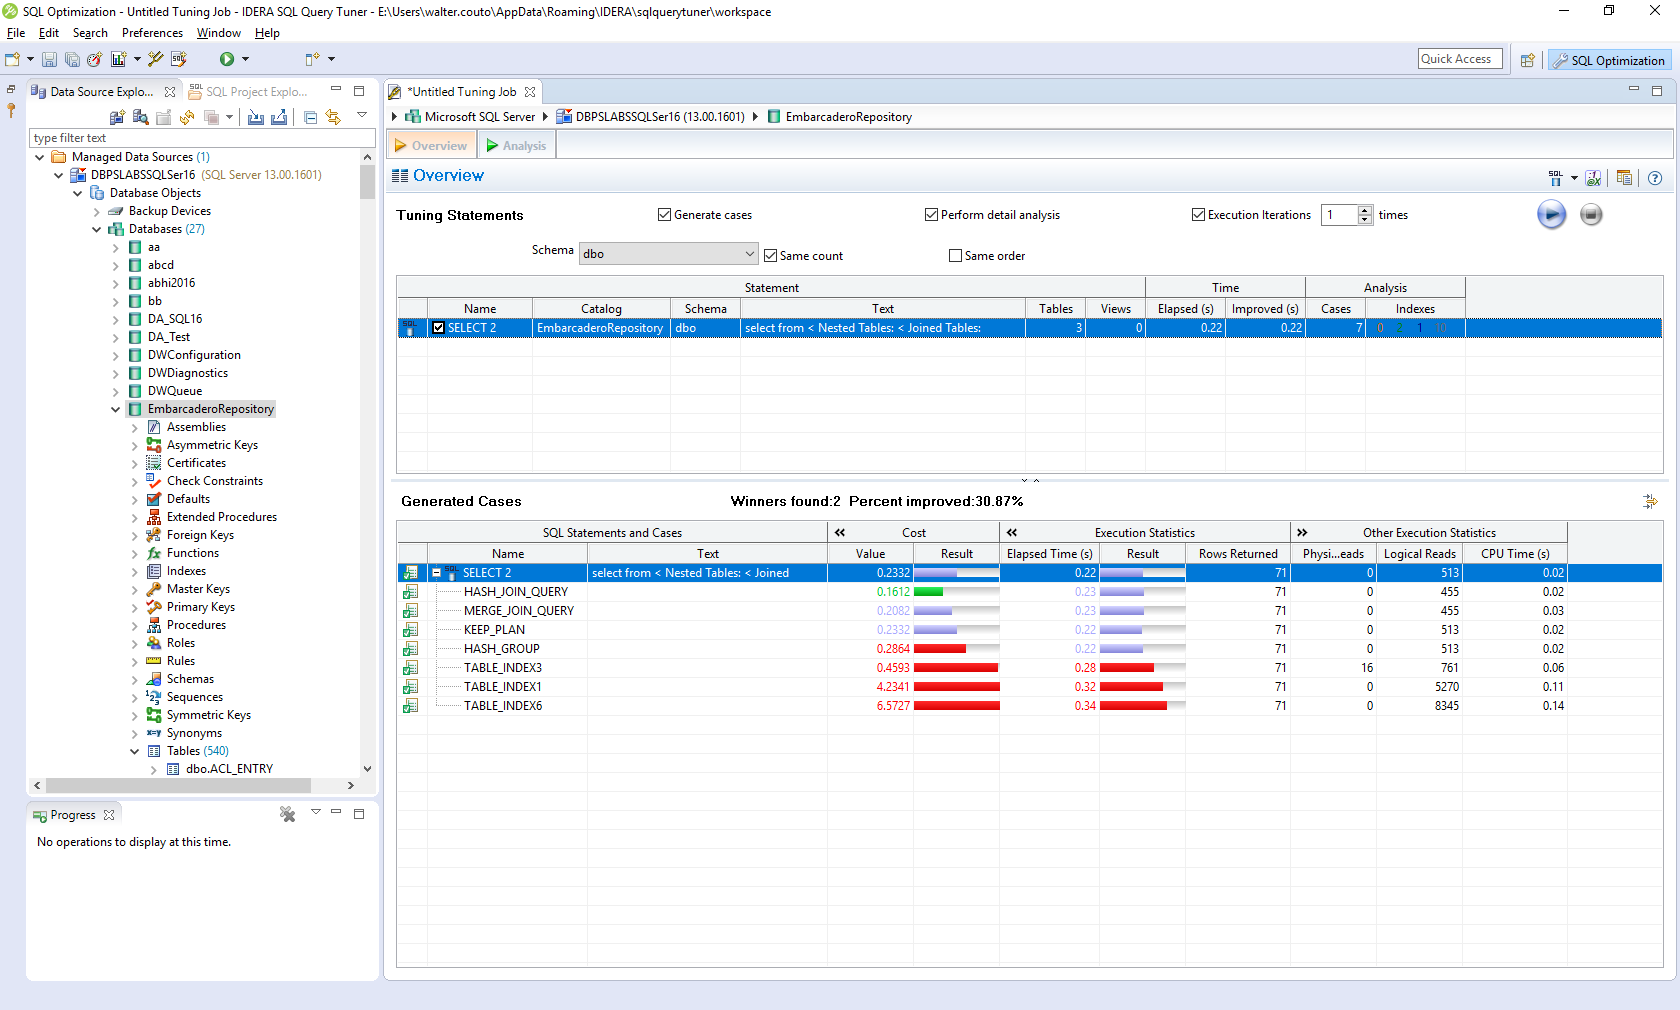
Generate SQL Statements and Cases: Create and run tuning jobs for a single statement or batch of statements. Tune all data manipulation language statements, stored routines, and entire SQL files. View execution statistics for SQL statements and cases. View suggested SQL query rewrites when generating cases in the SQL query tuner and when typing SQL code in the SQL integrated development environment.

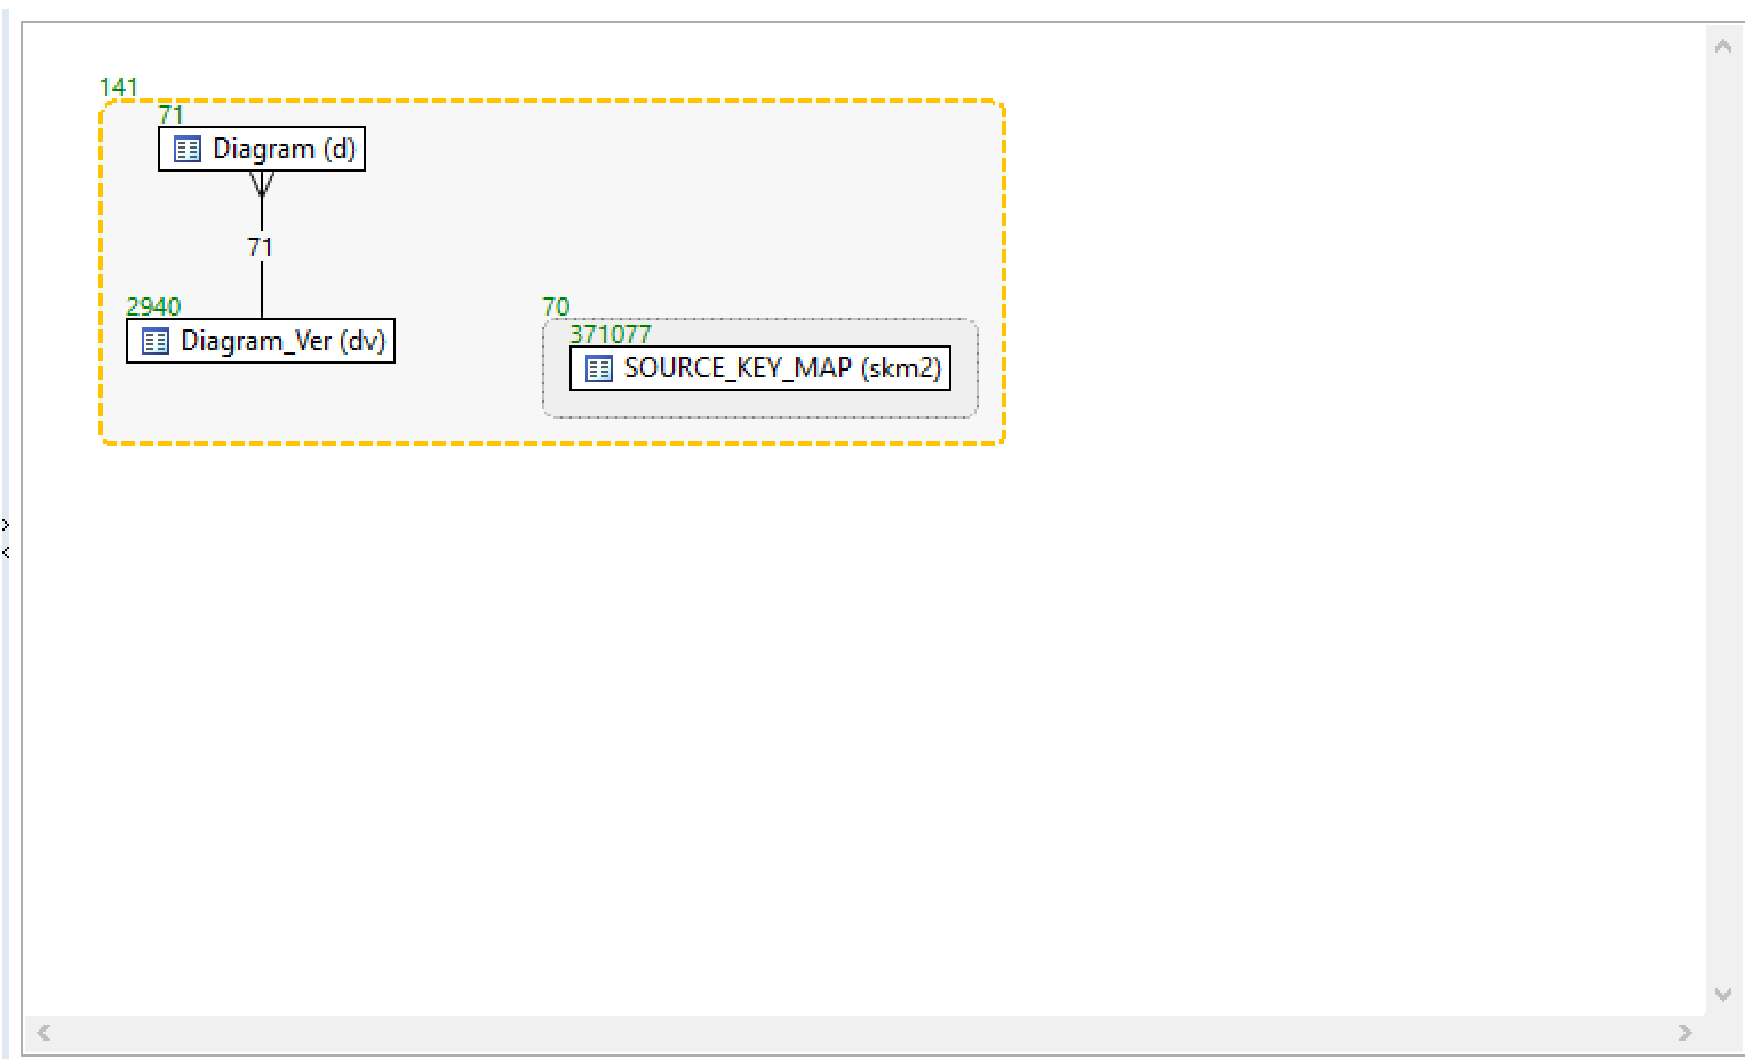
Visually Tune Complex SQL Queries: Unique in the industry, Visual SQL Tuning diagrams turn text-based SQL queries into graphical SQL query diagrams to show the impact of SQL statements on the SQL Server database. The Visual SQL Tuning diagram displays indexes and constraints on tables and views with table statistics, and the joins used in a SQL statement.

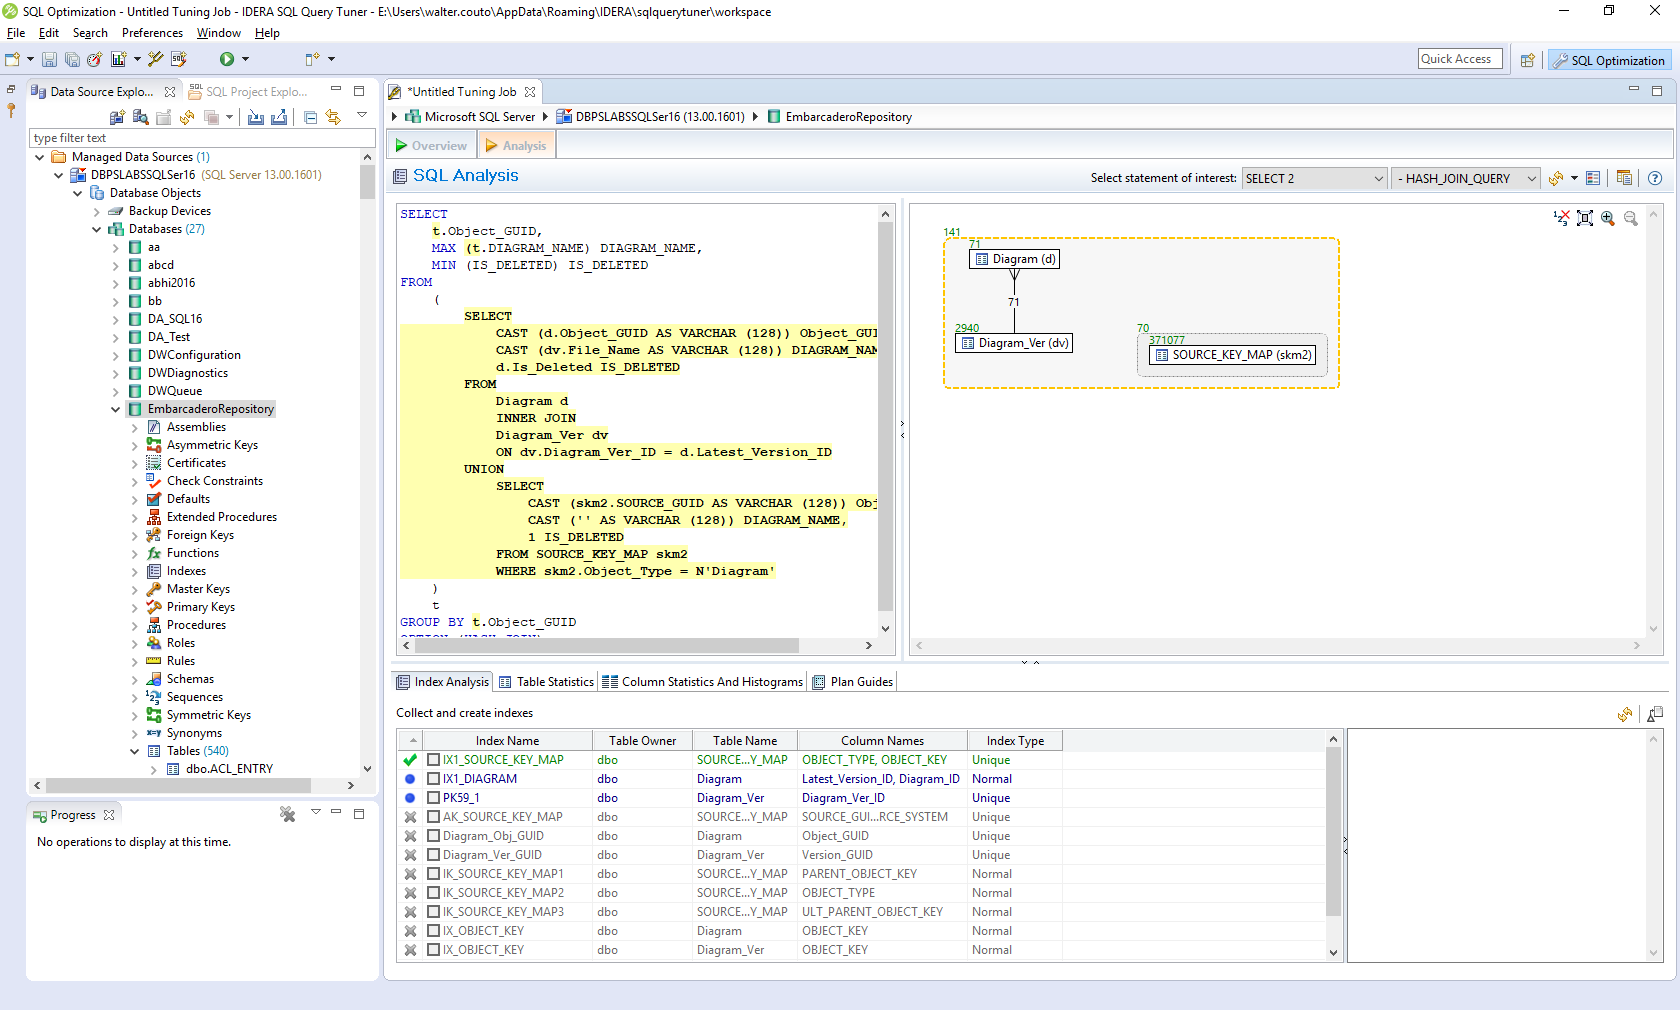
Tune SQL Queries like a Professional: The SQL query tuning wizard automatically suggests solutions for tuning SQL queries for SQL Server. The color-coded Index Analysis shows used, not used, or missing indexes and offers recommendations for optimum performance. Find the best alternative to a given SQL statement by including SQL query rewrites and hint injections.

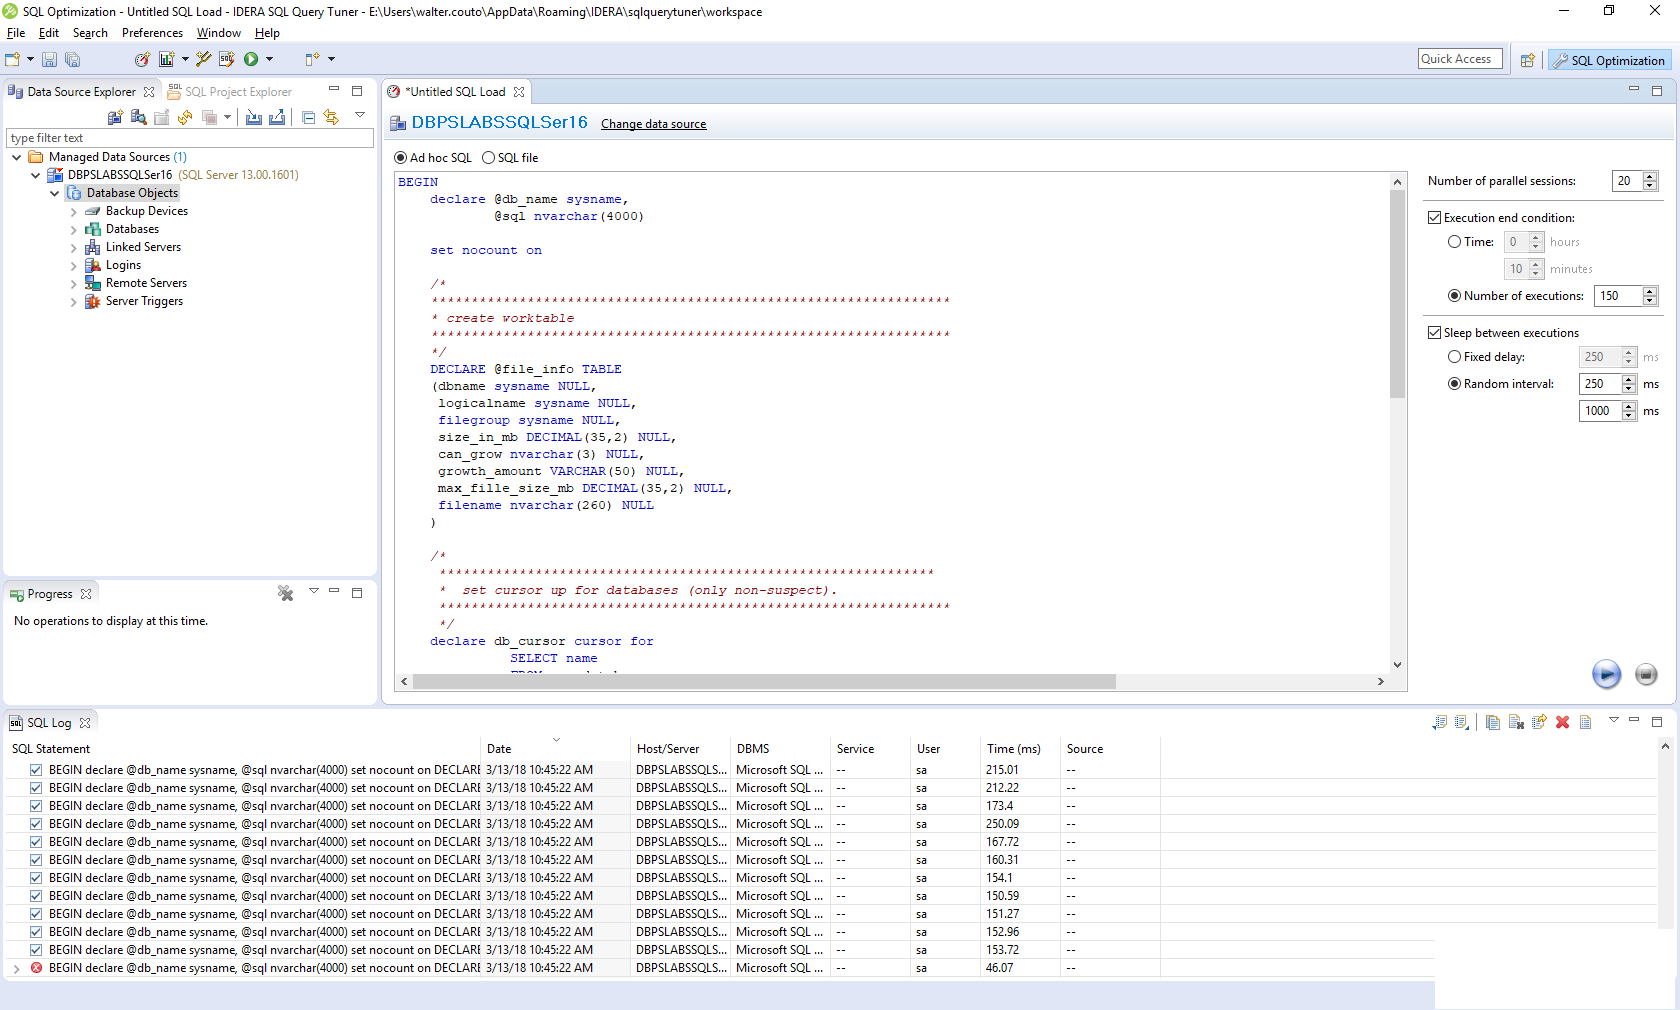
Simulate Production Environments: Load testing verifies the performance of existing and alternative SQL queries against the SQL Server database. Configure queries to run multiple times in parallel and see how they respond to simulated production environments without the risk of actually testing in production.

    Overview
    Organizational Impact
    • Improve database end-user experience.
    • Improve database workload and database performance against organization-oriented service-level agreements.
    • Reduce lost staff productivity due to database-related performance problems.
    • Decrease database-related IT costs.
    Team Impact
    • Shorten mean time to resolution of database issues.
    • Proactively resolve problems before they impact the organization.
    • Improve collaboration between database administrators and database developers.
    • Increase efficiency of database administrators and database developers.
    • Reduce finger-pointing from other IT groups and third-party vendors.
    • Maximize infrastructure investments by tuning database performance.
    Benefits
    • Identify problematic SQL queries via database profiling of wait time analysis.
    • View automatically generated tuning recommendations with the SQL query tuning wizard.
    • Understand the impact of SQL statements on the database using visual SQL tuning diagrams.
    • Verify SQL queries performance with load testing in simulated production environments.
    • Reduce training requirements and streamline collaboration for tuning SQL queries with the intuitive interface.
    Pinpoint Problematic SQL Queries with Wait Time Analysis

    Quickly and easily identify SQL queries that cause poor database performance via database profiling that displays a graphical visualization of wait time analysis. Monitor an entire data source within a configurable span of time with continuous profiling. Gain a better understanding of how SQL Server plans to execute SQL queries and the performance costs with explain plans. Share information captured during the profiling process with reporting.

    Receive Automated Tuning Suggestions

    View automatically generated suggested solutions with the SQL query tuning wizard to provide an essential context for tuning SQL queries. View color-coded index analysis for used, not used, and missing indexes with recommendations for optimum performance. Generate possible cases and find the best alternative to a given SQL statement by including SQL query rewrites and hint injections.

    Visually Tune Complex SQL Queries

    Turn text-based SQL queries into unique visual SQL query tuning diagrams. Understand the impact of SQL statements on the database using the diagrams instead of more complicated execution plans. Display indexes and constraints on tables and views with table statistics, and the joins used in a SQL statement (such as Cartesian joins, implied Cartesian joins, and many-to-many relationships) with the diagrams.

    Load Test in Simulated Production Environments

    Verify the performance of existing and alternative SQL queries against the database via load testing. Configure SQL queries to run multiple times in parallel and to observe how they respond to simulated production environments without the risk of actually testing in production.

    Streamline SQL Query Tuning for SQL Server

    Tune poorly performing SQL queries for SQL Server from an intuitive interface. Reduce training requirements and streamline collaboration among teams across the organization.
    Continuous Wait State and Transaction Monitoring

    Monitor wait states and capture transactions of applications. Get a real-time view of the entire instance and database with continuous sampling and high granularity as fast as 1 second.

    Quick Drill-down for Actionable Advice

    Easily drill down to isolate problems quickly. View details of the captured transactions – such as top CPU activity, waits, databases, and statements versus top logins, machines, and applications – to pinpoint problems. Display and tune execution plans with actionable expert recommendations, illuminate demanding transactions, and resolve locks and latches.

    Historical Query Plan Trends

    SQL Workload Analysis for SQL Server delivers valuable real-time and historical data to help tune queries. Investigate historical query plan trends in SQL Server 2005 and newer systems.

    Integration with SQL Diagnostic Manager for SQL Server

    SQL Workload Analysis for SQL Server integrates with SQL Diagnostic Manager for SQL Server to provide wait state and transaction monitoring. From the dashboard of SQL Diagnostic Manager for SQL Server, launch SQL Workload Analysis for SQL Server in context to isolate further the transaction causes of alerts of SQL Diagnostic Manager for SQL Server for a quick resolution.

    Simple Web-based Dashboard

    SQL Workload Analysis for SQL Server provides a single web-based interface that is accessible via a browser from any machine that can connect to the framework machine. The customizable dashboard displays a quick and comprehensive overview of statistical analysis and activity trends of top database activity. Quickly drill down into the details of the captured transactions to isolate slow SQL statements, illuminate demanding operators, receive automatic expert recommendations to improve SQL queries, and analyze and tune execution plans.

    Agentless and Low Impact

    SQL Workload Analysis for SQL Server monitors SQL Server instances remotely from a dedicated framework machine. SQL Workload Analysis for SQL Server is agentless and does not install additional services, databases, tables, extended stored procedures or anything else on the production systems. This simple architecture significantly reduces server footprint, simplifies the installation and upgrade process, and eliminates risk agents on the performance of the monitored SQL servers.

    Details

    SQL Query Tuning

    Enjoy Intuitive Tuning Interface

    Automate SQL query tuning for SQL Server from the intuitive interface. Streamline and automate frequent and repetitive tasks with an easy-to-use graphical user interface and powerful wizards.

    Tune in Batches

    Create and run tuning jobs for a single statement or a batch of statements. Tune all data manipulation language statements, stored routines, and entire SQL files.

    Rewrite SQL Queries

    Generate cases in the SQL tuner or type SQL queries into the integrated development environment to view suggested SQL rewrites.

    Generate Cases

    Generate all possible cases and find the best alternative to a given SQL statement with SQL query rewrites and hint injection.

    Manage Hint Injection

    Customize the subset of hints for consideration for hint injection and alternative execution paths.

    View Explain Plan Cost

    Display the explain plan cost for each original statement and each generated case to examine the expected cost given the execution path utilized by SQL Server.

    Visually Tune SQL Queries

    Turn text-based SQL queries into graphical tuning diagrams that display the tables and views used in the queries, and the relationships defined in those queries. Display indexes and constraints on tables and views, and the joins used in a SQL statement (such as Cartesian joins, implied Cartesian joins and many-to-many relationships) with table statistics with the visual tuning diagrams.

    Analyze Indexes

    View used, not used, and missing indexes and view indexing recommendations for optimum performance with the color-coded index analysis.

    Examine Execution Statistics

    Discover the fastest running SQL statement by running SQL queries with alternative execution paths, and apply the change with a single button click.

    Compare Cases

    Spot the textual differences between any two SQL statements with the visual difference viewer.

    SQL Query Profiling

    Use Low-impact Sampling

    Identify and diagnose performance bottlenecks and problematic SQL queries without agents and without placing a significant load on the target database.

    Test under Load

    Simulate parallel users and parallel executions over a specific period or execution cycle with stress testing of SQL queries.

    Profile Continuously

    Continuously profile an entire data source within a configurable span of time.

    Show Live Data

    Show data in real-time while profiling is in progress.

    Share Profile Sessions

    Save all data and metadata about a profile session as a single entity into an archive file. Share profiles across multiple workspaces and machines to collaborate with others.

    Visual diagnostics

    View Profile Chart

    Show the CPU, input and output, and other wait activity over the course of the session in the profile chart, and zoom in and out as desired.

    Examine Execution Statistics

    Display detailed information on the profiled SQL query and wait categories. Break down this information into SQL statements, events, and sessions.

    Drill Down into Profiling Details

    Drill down into the execution details for any given statement which includes the SQL query text, events, sessions, child cursors, blockers, procedures, and SQL query details.

    Summarize Execution Analysis

    Roll up SQL statements for an accurate analysis of the number of executions in real-time.

    Generate Explain Plans

    Compute the explain plan for each SQL statement on demand via a context menu item in the execution statistics table. Display the explain plan in a separate view as a tree with columns and collapsible column groups.

    Crop Time Displays

    Highlight a time interval in the profile chart to instantly change the data displayed to make it easier to see the details.

    Enterprise Manangement

    Store Profiling Data

    Stream profiling data into a central repository for the open session.

    Save Profiling Session

    Save an entire profiling session to file for future analysis and reference, and to share with others.

    Automate and Remote-control Tuning Sessions

    Automate and launch profiling and tuning sessions remotely with the intuitive command-line interface.

    Use Unicode Characters

    Utilize Unicode characters throughout the application.

    Tec Specs

    System Requirements

    Operating Systems

    • Microsoft Windows: 10, 8.1, 8, 7, Server 2008 SP1, Server 2008 R2, Server 2012, Server 2012 R2, Server 2016; 32- and 64-bit.

    Database Platforms

    SQL Execution Tuning

    • Microsoft SQL Server: 2008, 2012, 2014, 2016, 2017 (Windows and Linux)
    • Microsoft SQL Server 2019 (experimental support)
    • Java Database Connectivity (for execution only)

    SQL Workload Profiling

    • Microsoft SQL Server: 2008, 2012, 2014, 2016, 2017
    • Microsoft SQL Server 2019 (experimental support)

    Version History

    Version 17.0.4

    • Support for SQL Server 2019 (Windows and Linux) (experimental support)
    • Bug fixes

    Version 17.0.3

    • Support for Windows authentication on all Windows platforms including Windows Server 2016
    Resources

    SQL Query Tuner for SQL Server Product Video

    Watch this video to learn about how SQL Query Tuner can help you to boost the performance monitoring power of SQL Diagnostic Manager with SQL query tuning for SQL Server.

    null

    Read the Datasheet

    Everything you need you need to know, all in one downloadable PDF.
    DOWNLOAD THE DATASHEET
    null

    View a Democast

    Let a pro show you some tips and tricks, live and free!
    REGISTER FOR A DEMOCAST
    (SQL Query Tuner is an add-on to SQL Diagnostic Manager.)
    Compare
    Compare the Best SQL Server Query Tuning Tools

    IDERA relentlessly delivers the industry’s most complete solution for profiling and tuning SQL queries for SQL Server and tirelessly supports the SQL Server community with 100% free tools and expert advice.

    Compare, side by side, the features and functionalities of the best SQL Server query tuning tools the market has to offer. Download a free trial today.
    (SQL Query Tuner is an add-on to SQL Diagnostic Manager.)

    IDERA SQL Query TunerSQL Sentry® Plan ExplorerQuest® SQL OptimizerSQL® Server Management Studio
    Capture Workload Profile by scanning database for SQL query execution activity for the period.Add-on
    SQL Tuning Session via manual typing within SQL query editor or loading a text file.
    SQL Tuning Session by scanning database for current SQL query execution activity.
    Display SQL statement's database execution plan.
    Automatically generate SQL query rewrites to improve runtime statistics potentially.
    he user can specify rules for automatic SQL query rewrite allowances and exclusions.
    SQL query rewrites can generate candidates using native database optimizer hints.
    SQL query rewrites can generate candidates by transforming the SQL syntax itself.
    Recommend missing indexes which would improve execution plan.
    Test SQL Load Scalability by running multiple concurrent sessions for SQL statement.
    Visual Tuning Diagram that clarifies the data context, data relationships, data sizes, and join relationships.

    With a rich set of features, IDERA SQL Query Tuner enables DBAs and developers to quickly improve the performance of their SQL queries for SQL Server like a professional.

    Tour

    SQL Query Tuner for SQL Server Product Tour

    SQL Query Execution Performance: Identify and diagnose performance bottlenecks and problematic SQL queries for SQL Server without agents or placing a significant load on the target database. The profile chart shows the CPU, input and output, and other wait activity over the course of the session, in real-time while profiling is in progress. Drill down into the execution details for any given statement, including the SQL query text, events, sessions, child cursors, blockers, procedures, and SQL query details.

    Generate SQL Statements and Cases: Create and run tuning jobs for a single statement or batch of statements. Tune all data manipulation language statements, stored routines, and entire SQL files. View execution statistics for SQL statements and cases. View suggested SQL query rewrites when generating cases in the SQL query tuner and when typing SQL code in the SQL integrated development environment.

    Visually Tune Complex SQL Queries: Unique in the industry, Visual SQL Tuning diagrams turn text-based SQL queries into graphical SQL query diagrams to show the impact of SQL statements on the SQL Server database. The Visual SQL Tuning diagram displays indexes and constraints on tables and views with table statistics, and the joins used in a SQL statement.

    Tune SQL Queries like a Professional: The SQL query tuning wizard automatically suggests solutions for tuning SQL queries for SQL Server. The color-coded Index Analysis shows used, not used, or missing indexes and offers recommendations for optimum performance. Find the best alternative to a given SQL statement by including SQL query rewrites and hint injections.

    Simulate Production Environments: Load testing verifies the performance of existing and alternative SQL queries against the SQL Server database. Configure queries to run multiple times in parallel and see how they respond to simulated production environments without the risk of actually testing in production.

    Download

      No credit card required. Fully functional for 14 days!

      (SQL Query Tuner is an add-on to SQL Diagnostic Manager.)

      Buy Now

      Includes first year of maintenance.
      Volume discounts available

      (SQL Query Tuner is an add-on to SQL Diagnostic Manager.)

      Need pricing options?

      Request a quote for SMB or
      multi-license discount pricing.

      SQL Query Tuner is an add-on to SQL Diagnostic Manager.)

      Live Product Demo

      ee SQL Query Tuner in action with a seasoned pro.

      (SQL Query Tuner is an add-on to SQL Diagnostic Manager.)

      (SQL Workload Analysis is an add-on to SQL Diagnostic Manager.)

      No credit card required. Fully functional for 14 days!