Grow your business by maximizing the availability and
performance of your SQL Server databases with
robust diagnostics, intelligent alerts, and expert recommendations.
Your business depends on the reliability and speed of your SQL Server databases to
support mission-critical applications. IDERA tools provide DBAs with reliable real-time
information on the status and health of the entire SQL Server environment along with
tools to quickly predict, pinpoint, and resolve performance issues.
Try SQL Diagnostic Manager for SQL Server for free today!


FIND QUERY BOTTLENECKS
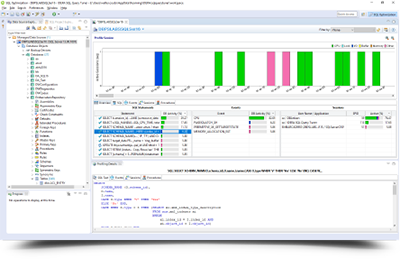
Keep data delivery fast and consistent by spotting the queries that are slowing your system down, with query capture, sophisticated filtering, and user-friendly visualizations.
ALERT PREDICTIVELY
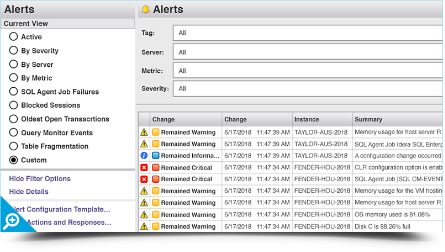
Avoid scrambling to fix database problems with customizable and predictive alerts to spot approaching issues. Keep administrators and users in the know about system health, with automatic email notifications, Windows taskbar notifications, Windows Event Log notices, and SQL and PowerShell script execution.


VIEW EXPERT ADVICE
Solve everyday problems fast and improve database performance with expert recommendations. Apply fixes enterprise-wide with a unified, intuitive interface—from configuration to query construction, security to memory use.
VIEW TOP ISSUES AND ALERTS
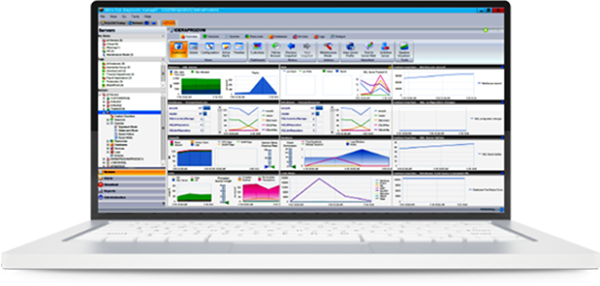
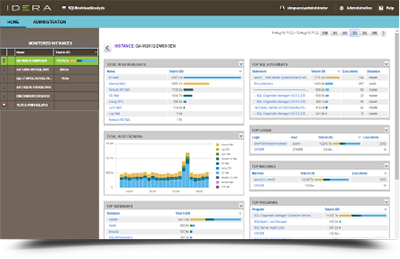
Save time by giving administrators a single-pane-of-glass interface for monitoring and alerts. Your databases are all in sight, and all in one place, for fast action when something goes wrong.

Monitor tempdb
Identify and resolve tempdb contention and performance problems, and check and display the space and performance information of your tempdb instances.
Monitor and analyze continuously
Know at a glance the real-time availability, health, and performance of your SQL Server instances. Spot issues fast with metrics analysis across hundreds of instances.
Deploy for physical, virtual, and cloud environments
Ensure continuity by monitoring the performance of physical servers, virtual servers, and cloud servers to get a complete, continuous view of your SQL Server environment.
Manage availability groups
Efficiently manage the topology of high-availability groups. Even during failover, get monitoring and alerting on your clusters, mirrors, and replication.
Customize counters
Tailor your systems’ monitoring and reporting with custom counters. Get application-specific monitoring with Windows Performance Monitor counters and SQL queries.
Manage jobs
Monitor and alert on your jobs—success, failure, cancellation, or retry. View all jobs and their last known status, and the complete history of jobs. Also, conveniently start and stop jobs from the same interface.
Monitor operating systems
Collect performance metrics for all your systems at the operating system level using Windows Management Instrumentation, and Object Linking & Embedding.
Alert based on best practices
Get alerts customized for your industry and your enterprise: Choose from over 100 predefined alert settings based on industry best practices. Modify your configuration settings for greater flexibility.
Alert to different audiences
Get the message out to the right people. Advanced notifications let you send alerts to different groups of people based on metrics, time-of-day, instance, and more.
Set up maintenance mode
Avoid false positives by selectively disabling SQL Diagnostic Manager monitoring and alerting during maintenance periods for on-demand, one-time, and weekly scheduled maintenance periods.
Smooth and snooze alerts
Help admins work without distraction. SQL Diagnostic Manager can smooth problematic metrics that occasionally spike, to delay the first alert and save you stress. Snoozing alerts prevents intrusive, recurring alerts while addressing problems.
Quickly deploy alerts across instances
Easily put your custom alerts in place across your infrastructure. Add and modify metrics to alerts for multiple servers with the default alert configuration and the copy-to operation.
Alert from baselines
Know your business reality: Capture baselines of past performance to configure baseline alerts that automatically calibrate to changes within your system to avoid excessive noise and false positives.
Automate alert response actions
Give your admins more ways to respond, with customized, automated alert-response actions for system notifications, email, SQL scripts, PowerShell scripts, and more.
View recommendations for alert thresholds
Avoid alert fatigue. For metrics that always alert, view flags that indicate needed changes—with suggestions for new limits..
View locks, blocks, and deadlocks
For easy problem identification and resolution, view the complete blocking chain by identifying real-time and historical session locks, blocks, and deadlocks.
View activity timelines
Understand events faster and more intuitively by viewing color-coded performance events on your server on a timeline calendar instead of only as a list of events. Use a sliding scale to zoom in to specific times.
View fragmentation
Quickly remedy one of the most common causes of performance degradation: View statistics on fragmentation to identify indexes that may need defragmentation.
Run PowerShell scripts
Get even more control over SQL Diagnostic Manager by deploying Microsoft PowerShell, and automatically respond to alerts with PowerShell scripts.
Browse historical data
Reduce future problems by understanding the multiple factors behind database issues. Examine historical trends and drill down to the precise point in time a problem emerged.
Set up multiple baselines
Compare the performance baselines that matter to your business by defining and scheduling multiple baseline periods.
Integrate with SCOM
Share data with IT operations for efficiency by propagating the status, health, and events of monitored instances to Microsoft’s System Center Operations Manager (SCOM).
Plan capacity
Confidently plan the future of your storage infrastructure. View charts and create reports with trends and metrics to help forecast future capacity needs.
See overview and drill down
View your entire environment in the customizable dashboard and drill down to find the causes of problems. Get flexible monitoring by specifying multiple dashboards per instance.
Access on mobile devices
View real-time and historical performance—and diagnose and resolve performance issues—from anywhere, with smartphone or tablet access.
Apply granular application security
Smoothly address varying access needs with access to your servers and instances via fine-grained security permissions for different groups of people.
Deploy for hybrid cloud
Consolidate vital information and plan for the cloud-centric future by deploying SQL Diagnostic Manager to simultaneously monitor your on-premises databases, databases on cloud virtual machines, and managed cloud databases.
Deploy via web browser
Avoid the installation and maintenance of desktop consoles, and reach a diverse pool of users and endpoints, by deploying SQL Diagnostic Manager access via a web browser.
Share configurations
Export and import configuration files to efficiently share customized dashboards, counters, alert templates, and reports with other users across your organization.
Report comprehensively
Gain insights about your data quickly with predefined and customized reports. Report on performance trends and forecasts for capacity planning. Deploy reports to SQL Server Reporting Services.
Install on cloud virtual machines
Unify your control by running SQL Diagnostic Manager for SQL Server on cloud virtual machines with Windows—such as Amazon Elastic Compute Cloud (EC2) and Azure virtual machines.
Monitor SQL Server on cloud virtual machines
Monitor your SQL Server instances running on cloud virtual machines with virtualization software that is compatible with VMware and Microsoft Hyper-V—such as Amazon EC2 and Azure virtual machines.
Monitor hybrid environments with a single tool
Save time by using the same performance-monitoring tool for SQL Server databases on-premises (on your physical and virtual machines); in the private, public, and government cloud (on virtual machines); and in the public and government cloud (as managed databases).
Access mapped cloud drives
Get the most out the cloud with cloud storage that is mapped as network drives or removable drives on Windows with SQL Diagnostic Manager for SQL Server. For example, map storage to Amazon Simple Storage Service (S3) and Azure Blob Storage.
Monitor managed SQL Server cloud databases
Extend your cloud capabilities with monitoring for Azure SQL Database and Amazon RDS for SQL Server.
- Performance Monitoring
-
Monitor tempdb
Identify and resolve tempdb contention and performance problems, and check and display the space and performance information of your tempdb instances.
Monitor and analyze continuously
Know at a glance the real-time availability, health, and performance of your SQL Server instances. Spot issues fast with metrics analysis across hundreds of instances.
Deploy for physical, virtual, and cloud environments
Ensure continuity by monitoring the performance of physical servers, virtual servers, and cloud servers to get a complete, continuous view of your SQL Server environment.
Manage availability groups
Efficiently manage the topology of high-availability groups. Even during failover, get monitoring and alerting on your clusters, mirrors, and replication.
Customize counters
Tailor your systems’ monitoring and reporting with custom counters. Get application-specific monitoring with Windows Performance Monitor counters and SQL queries.
Manage jobs
Monitor and alert on your jobs—success, failure, cancellation, or retry. View all jobs and their last known status, and the complete history of jobs. Also, conveniently start and stop jobs from the same interface.
Monitor operating systems
Collect performance metrics for all your systems at the operating system level using Windows Management Instrumentation, and Object Linking & Embedding.
- Alerting
-
Alert based on best practices
Get alerts customized for your industry and your enterprise: Choose from over 100 predefined alert settings based on industry best practices. Modify your configuration settings for greater flexibility.
Alert to different audiences
Get the message out to the right people. Advanced notifications let you send alerts to different groups of people based on metrics, time-of-day, instance, and more.
Set up maintenance mode
Avoid false positives by selectively disabling SQL Diagnostic Manager monitoring and alerting during maintenance periods for on-demand, one-time, and weekly scheduled maintenance periods.
Smooth and snooze alerts
Help admins work without distraction. SQL Diagnostic Manager can smooth problematic metrics that occasionally spike, to delay the first alert and save you stress. Snoozing alerts prevents intrusive, recurring alerts while addressing problems.
Quickly deploy alerts across instances
Easily put your custom alerts in place across your infrastructure. Add and modify metrics to alerts for multiple servers with the default alert configuration and the copy-to operation.
Alert from baselines
Know your business reality: Capture baselines of past performance to configure baseline alerts that automatically calibrate to changes within your system to avoid excessive noise and false positives.
Automate alert response actions
Give your admins more ways to respond, with customized, automated alert-response actions for system notifications, email, SQL scripts, PowerShell scripts, and more.
View recommendations for alert thresholds
Avoid alert fatigue. For metrics that always alert, view flags that indicate needed changes—with suggestions for new limits..
- Diagnostics and Analytics
-
View locks, blocks, and deadlocks
For easy problem identification and resolution, view the complete blocking chain by identifying real-time and historical session locks, blocks, and deadlocks.
View activity timelines
Understand events faster and more intuitively by viewing color-coded performance events on your server on a timeline calendar instead of only as a list of events. Use a sliding scale to zoom in to specific times.
View fragmentation
Quickly remedy one of the most common causes of performance degradation: View statistics on fragmentation to identify indexes that may need defragmentation.
Run PowerShell scripts
Get even more control over SQL Diagnostic Manager by deploying Microsoft PowerShell, and automatically respond to alerts with PowerShell scripts.
Browse historical data
Reduce future problems by understanding the multiple factors behind database issues. Examine historical trends and drill down to the precise point in time a problem emerged.
Set up multiple baselines
Compare the performance baselines that matter to your business by defining and scheduling multiple baseline periods.
Integrate with SCOM
Share data with IT operations for efficiency by propagating the status, health, and events of monitored instances to Microsoft’s System Center Operations Manager (SCOM).
Plan capacity
Confidently plan the future of your storage infrastructure. View charts and create reports with trends and metrics to help forecast future capacity needs.
- Enterprise Management
-
See overview and drill down
View your entire environment in the customizable dashboard and drill down to find the causes of problems. Get flexible monitoring by specifying multiple dashboards per instance.
Access on mobile devices
View real-time and historical performance—and diagnose and resolve performance issues—from anywhere, with smartphone or tablet access.
Apply granular application security
Smoothly address varying access needs with access to your servers and instances via fine-grained security permissions for different groups of people.
Deploy for hybrid cloud
Consolidate vital information and plan for the cloud-centric future by deploying SQL Diagnostic Manager to simultaneously monitor your on-premises databases, databases on cloud virtual machines, and managed cloud databases.
Deploy via web browser
Avoid the installation and maintenance of desktop consoles, and reach a diverse pool of users and endpoints, by deploying SQL Diagnostic Manager access via a web browser.
Share configurations
Export and import configuration files to efficiently share customized dashboards, counters, alert templates, and reports with other users across your organization.
Report comprehensively
Gain insights about your data quickly with predefined and customized reports. Report on performance trends and forecasts for capacity planning. Deploy reports to SQL Server Reporting Services.
- Cloud
-
Install on cloud virtual machines
Unify your control by running SQL Diagnostic Manager for SQL Server on cloud virtual machines with Windows—such as Amazon Elastic Compute Cloud (EC2) and Azure virtual machines.
Monitor SQL Server on cloud virtual machines
Monitor your SQL Server instances running on cloud virtual machines with virtualization software that is compatible with VMware and Microsoft Hyper-V—such as Amazon EC2 and Azure virtual machines.
Monitor hybrid environments with a single tool
Save time by using the same performance-monitoring tool for SQL Server databases on-premises (on your physical and virtual machines); in the private, public, and government cloud (on virtual machines); and in the public and government cloud (as managed databases).
Access mapped cloud drives
Get the most out the cloud with cloud storage that is mapped as network drives or removable drives on Windows with SQL Diagnostic Manager for SQL Server. For example, map storage to Amazon Simple Storage Service (S3) and Azure Blob Storage.
Monitor managed SQL Server cloud databases
Extend your cloud capabilities with monitoring for Azure SQL Database and Amazon RDS for SQL Server.
Let’s get started.
Start your 14-day trial, no credit card required (but all fields are)


