- Granular wait state monitoring
- Continuous SQL sampling
- Intuitive drill down to view top activity
- Query plan tuning and recommendations
- Lock and latch resolutions
- Storage visibility and contention resolution
Continuous Wait State and Transaction Monitoring
Monitor wait states and capture transactions of applications. Get a real-time view of the entire instance and database with continuous sampling and high granularity as fast as 1 second.
Quick Drill-down for Actionable Advice
Easily drill down to isolate problems quickly. View details of the captured transactions – such as top CPU activity, waits, databases, and statements versus top logins, machines, and applications – to pinpoint problems. Display and tune execution plans with actionable expert recommendations, illuminate demanding transactions, and resolve locks and latches.
Historical Query Plan Trends
SQL Workload Analysis for SQL Server delivers valuable real-time and historical data to help tune queries. Investigate historical query plan trends in SQL Server 2005 and newer systems.
Integration with SQL Diagnostic Manager for SQL Server
SQL Workload Analysis for SQL Server integrates with SQL Diagnostic Manager for SQL Server to provide wait state and transaction monitoring. From the dashboard of SQL Diagnostic Manager for SQL Server, launch SQL Workload Analysis for SQL Server in context to isolate further the transaction causes of alerts of SQL Diagnostic Manager for SQL Server for a quick resolution.
Simple Web-based Dashboard
SQL Workload Analysis for SQL Server provides a single web-based interface that is accessible via a browser from any machine that can connect to the framework machine. The customizable dashboard displays a quick and comprehensive overview of statistical analysis and activity trends of top database activity. Quickly drill down into the details of the captured transactions to isolate slow SQL statements, illuminate demanding operators, receive automatic expert recommendations to improve SQL queries, and analyze and tune execution plans.
Agentless and Low Impact
SQL Workload Analysis for SQL Server monitors SQL Server instances remotely from a dedicated framework machine. SQL Workload Analysis for SQL Server is agentless and does not install additional services, databases, tables, extended stored procedures or anything else on the production systems. This simple architecture significantly reduces server footprint, simplifies the installation and upgrade process, and eliminates risk agents on the performance of the monitored SQL servers.
IDERA Dashboard Services
Microsoft Windows: Vista SP2+, Server 2008 SP2, Server 2008 R2, 7, Server 2012, 8, Server 2012 R2, 8.1, 10, Server 2016; 32-bit and 64-bit
Microsoft. NET Framework: 4.0+
IDERA Dashboard Repository
Microsoft SQL Server: 2005, 2008, 2008 R2, 2012, 2014, 2016; Express, Standard, and Enterprise Edition
Monitored Instances
Microsoft SQL Server: 2005, 2008, 2008 R2, 2012, 2014, 2016; Express, Standard, and Enterprise Edition
Web Browser
Microsoft Internet Explorer 10.x+, Google Chrome, Mozilla Firefox
Version 1.6.1
New stored procedure drill-down
SQL Workload Analysis for SQL Server Product Video
Watch this video to learn about how SQL Workload Analysis for SQL Server can help you to boost the performance monitoring power of SQL Diagnostic Manager with detailed transactional application monitoring.
SQL Workload Analysis for SQL Server Product Tour
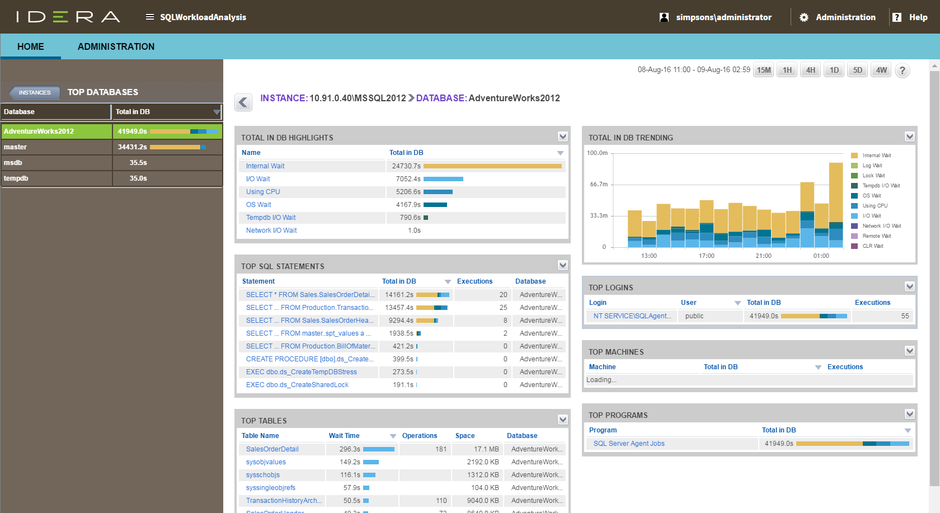
Monitored Instances : With the SQL Workload Analysis add-on for SQL Diagnostic Manager for SQL Server, view entire SQL Server instances in real-time with continuous sampling and high granularity to display a high-level overview of the top waits, databases, SQL statements, logins, machines and programs for a selected time interval.
Top Databases : Quickly drill down using the single, intuitive, web-based dashboard into a selected instance to view for a selected time interval the top database activity and trends in real-time.
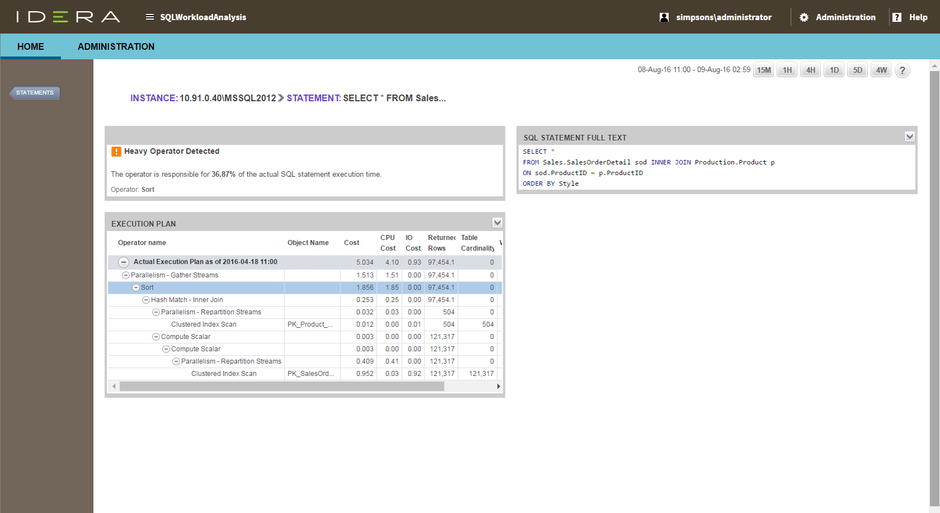
Details of SQL Statements : Drill down further into a selected SQL statement to view heavy operators and analyze execution plans to troubleshoot problematic queries.
Top SQL Statements : View top SQL statements and their statistics including top accessed objects to isolate slow SQL statements, and receive tuning recommendations to improve the performance of applications.
Top Tables :For a selected database, view the top tables and quickly drill down to view statistics, waits, table and index access, missing indexes, space allocation, top statements, and average I/O wait time to resolve locks, latches, and storage contention.
- Overview
-
- Granular wait state monitoring
- Continuous SQL sampling
- Intuitive drill down to view top activity
- Query plan tuning and recommendations
- Lock and latch resolutions
- Storage visibility and contention resolution
Continuous Wait State and Transaction Monitoring
Monitor wait states and capture transactions of applications. Get a real-time view of the entire instance and database with continuous sampling and high granularity as fast as 1 second.
Quick Drill-down for Actionable Advice
Easily drill down to isolate problems quickly. View details of the captured transactions – such as top CPU activity, waits, databases, and statements versus top logins, machines, and applications – to pinpoint problems. Display and tune execution plans with actionable expert recommendations, illuminate demanding transactions, and resolve locks and latches.
Historical Query Plan Trends
SQL Workload Analysis for SQL Server delivers valuable real-time and historical data to help tune queries. Investigate historical query plan trends in SQL Server 2005 and newer systems.
Integration with SQL Diagnostic Manager for SQL Server
SQL Workload Analysis for SQL Server integrates with SQL Diagnostic Manager for SQL Server to provide wait state and transaction monitoring. From the dashboard of SQL Diagnostic Manager for SQL Server, launch SQL Workload Analysis for SQL Server in context to isolate further the transaction causes of alerts of SQL Diagnostic Manager for SQL Server for a quick resolution.
Simple Web-based Dashboard
SQL Workload Analysis for SQL Server provides a single web-based interface that is accessible via a browser from any machine that can connect to the framework machine. The customizable dashboard displays a quick and comprehensive overview of statistical analysis and activity trends of top database activity. Quickly drill down into the details of the captured transactions to isolate slow SQL statements, illuminate demanding operators, receive automatic expert recommendations to improve SQL queries, and analyze and tune execution plans.
Agentless and Low Impact
SQL Workload Analysis for SQL Server monitors SQL Server instances remotely from a dedicated framework machine. SQL Workload Analysis for SQL Server is agentless and does not install additional services, databases, tables, extended stored procedures or anything else on the production systems. This simple architecture significantly reduces server footprint, simplifies the installation and upgrade process, and eliminates risk agents on the performance of the monitored SQL servers.
- Tec Specs
-
IDERA Dashboard Services
Microsoft Windows: Vista SP2+, Server 2008 SP2, Server 2008 R2, 7, Server 2012, 8, Server 2012 R2, 8.1, 10, Server 2016; 32-bit and 64-bit
Microsoft. NET Framework: 4.0+IDERA Dashboard Repository
Microsoft SQL Server: 2005, 2008, 2008 R2, 2012, 2014, 2016; Express, Standard, and Enterprise Edition
Monitored Instances
Microsoft SQL Server: 2005, 2008, 2008 R2, 2012, 2014, 2016; Express, Standard, and Enterprise Edition
Web Browser
Microsoft Internet Explorer 10.x+, Google Chrome, Mozilla Firefox
Version 1.6.1
New stored procedure drill-down
- Resources
-
SQL Workload Analysis for SQL Server Product Video
Watch this video to learn about how SQL Workload Analysis for SQL Server can help you to boost the performance monitoring power of SQL Diagnostic Manager with detailed transactional application monitoring.
- Tour
-
SQL Workload Analysis for SQL Server Product Tour
Monitored Instances : With the SQL Workload Analysis add-on for SQL Diagnostic Manager for SQL Server, view entire SQL Server instances in real-time with continuous sampling and high granularity to display a high-level overview of the top waits, databases, SQL statements, logins, machines and programs for a selected time interval.
Top Databases : Quickly drill down using the single, intuitive, web-based dashboard into a selected instance to view for a selected time interval the top database activity and trends in real-time.
Details of SQL Statements : Drill down further into a selected SQL statement to view heavy operators and analyze execution plans to troubleshoot problematic queries.
Top SQL Statements : View top SQL statements and their statistics including top accessed objects to isolate slow SQL statements, and receive tuning recommendations to improve the performance of applications.
Top Tables :For a selected database, view the top tables and quickly drill down to view statistics, waits, table and index access, missing indexes, space allocation, top statements, and average I/O wait time to resolve locks, latches, and storage contention.
- Download
-
No credit card required. Fully functional for 14 days!
(SQL Workload Analysis is an add-on to SQL Diagnostic Manager.)

Buy Now
Includes first year of maintenance.
Volume discounts available
(SQL Workload Analysis is an add-on to SQL Diagnostic Manager.)
Need pricing options?
Request a quote for SMB or
multi-license discount pricing.
(SQL Workload Analysis is an add-on to SQL Diagnostic Manager.)
Live Product Demo
See SQL Workload Analysis for SQL Server in action with a seasoned pro.
(SQL Workload Analysis is an add-on to SQL Diagnostic Manager.)
(SQL Workload Analysis is an add-on to SQL Diagnostic Manager.)


